
Step 1 of 6: Find the estimated slope. Round your answer to three decimal places
Step 2 of 6: Find the estimated y-intercept. Round your answer
to three decimal places.
Step 3 of 6: Determine if the statement "Not all points predicted
by the linear model fall on the same line" is true or false.
Step 4 of 6: Substitute the values you found in steps 1 and 2 into
the equation for the regression line to find the estimated linear
model. According to this model, if the value of the independent
variable is increased by one unit, then find the change in the
dependent variable yˆ.
Step 5 of 6: Find the estimated value of y when x=177. Round your
answer to three decimal places.
Step 6 of 6: Find the value of the coefficient of determination.
Round your answer to three decimal places.
Homework Answers
The statistical software output for this problem is :
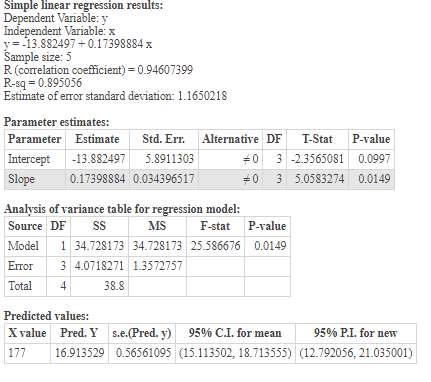
Step - 1) Slope = 0.174
Step - 2) Y-intercept = -13.882
Step - 3) False
Step - 4) the change in the dependent variable ˆy is = slope = 0.174
Step - 5) estimated value = 16.914
Step - 6) the coefficient of determination = 0.895
Add Answer to:
Step 1 of 6: Find the estimated slope. Round your answer to
three decimal places
Step...
Step 2 of 6: Find the estimated y-intercept. Round your answer to three decimal places. Step...
 Step 2 of 6:
Find the estimated y-intercept. Round your answer to three
decimal places.
Step 3 of 6:
Find the estimated value of y when x=156x=156. Round your answer
to three decimal places.
Step 4 of 6:
Determine if the statement "Not all points predicted by the
linear model fall on the same line" is true or false.
Step 6 of 6:
Find the value of the coefficient of determination. Round your
answer to three decimal places.
The table...
Step 2 of 6:
Find the estimated y-intercept. Round your answer to three
decimal places.
Step 3 of 6:
Find the estimated value of y when x=156x=156. Round your answer
to three decimal places.
Step 4 of 6:
Determine if the statement "Not all points predicted by the
linear model fall on the same line" is true or false.
Step 6 of 6:
Find the value of the coefficient of determination. Round your
answer to three decimal places.
The table...
Step 1 of 6: Find the estimated Slope. Round your answer to three decimal places. Step...
 Step 1 of 6: Find the estimated Slope. Round your answer to
three decimal places.
Step 2 of 6: Find the estimated y-intercept. Round your answer
to three decimals places.
Step 3 of 6: According to the estimated linear model, if the
value of the independent variable is increased by one unit, then
the change in the dependent variable y^ is given by?
Step 4 of 6: Determine if the statement "Not all points
predicted by the linear model fall...
Step 1 of 6: Find the estimated Slope. Round your answer to
three decimal places.
Step 2 of 6: Find the estimated y-intercept. Round your answer
to three decimals places.
Step 3 of 6: According to the estimated linear model, if the
value of the independent variable is increased by one unit, then
the change in the dependent variable y^ is given by?
Step 4 of 6: Determine if the statement "Not all points
predicted by the linear model fall...
The table below gives the list price and the number of bids received for five randomly selected items sold through online auctions. Using this data, consider the equation of the regression line, yˆ=b0...
The table below gives the list price and the number of bids received for five randomly selected items sold through online auctions. Using this data, consider the equation of the regression line, yˆ=b0+b1x, for predicting the number of bids an item will receive based on the list price. Keep in mind, the correlation coefficient may or may not be statistically significant for the data given. Remember, in practice, it would not be appropriate to use the regression line to make...
The table below gives the list price and the number of bids received for five randomly...
The table below gives the list price and the number of bids received for five randomly selected items sold through online auctions. Using this data, consider the equation of the regression line, yˆ=b0+b1xy^=b0+b1x, for predicting the number of bids an item will receive based on the list price. Keep in mind, the correlation coefficient may or may not be statistically significant for the data given. Remember, in practice, it would not be appropriate to use the regression line to make...
The table below gives the list price and the number of bids received for five randomly...
The table below gives the list price and the number of bids received for five randomly selected items sold through online auctions. Using this data, consider the equation of the regression line, yˆ=b0+b1x, for predicting the number of bids an item will receive based on the list price. Keep in mind, the correlation coefficient may or may not be statistically significant for the data given. Remember, in practice, it would not be appropriate to use the regression line to make...
Question 1 of 3, Step 6 of 6 4/18 Correct The table below gives the list...
 Question 1 of 3, Step 6 of 6 4/18 Correct The table below gives the list price and the number of bids received for five randomly selected items sold through online auctions. Using this data, consider the equation of the regression line, ŷ = bo + bix, for predicting the number of bids an item will receive based on the list price. Keep in mind, the correlation coefficient may or may not be statistically significant for the data given. Remember,...
Question 2 - of 24 Step 1 of 6 02:46:10 The table below gives the list...
 Question 2 - of 24 Step 1 of 6 02:46:10 The table below gives the list price and the number of bids received for five randomly selected items sold through online auctions. Using this data. consider the equation of the regression line, y = bo + bx, for predicting the number of bids an item will receive based on the list price. Keep in mind, the correlation coefficient may or may not be statistically significant for the data given. Remember,...
The table below gives the list price and the number of bids received for five randomly...
The table below gives the list price and the number of bids received for five randomly selected items sold through online auctions. Using this data, consider the equation of the regression line, yˆ=b0+b1xy^=b0+b1x, for predicting the number of bids an item will receive based on the list price. Keep in mind, the correlation coefficient may or may not be statistically significant for the data given. Remember, in practice, it would not be appropriate to use the regression line to make...
 Step 2 of 6:
Find the estimated y-intercept. Round your answer to three
decimal places.
Step 3 of 6:
Find the estimated value of y when x=156x=156. Round your answer
to three decimal places.
Step 4 of 6:
Determine if the statement "Not all points predicted by the
linear model fall on the same line" is true or false.
Step 6 of 6:
Find the value of the coefficient of determination. Round your
answer to three decimal places.
The table...
Step 2 of 6:
Find the estimated y-intercept. Round your answer to three
decimal places.
Step 3 of 6:
Find the estimated value of y when x=156x=156. Round your answer
to three decimal places.
Step 4 of 6:
Determine if the statement "Not all points predicted by the
linear model fall on the same line" is true or false.
Step 6 of 6:
Find the value of the coefficient of determination. Round your
answer to three decimal places.
The table...
 Step 1 of 6: Find the estimated Slope. Round your answer to
three decimal places.
Step 2 of 6: Find the estimated y-intercept. Round your answer
to three decimals places.
Step 3 of 6: According to the estimated linear model, if the
value of the independent variable is increased by one unit, then
the change in the dependent variable y^ is given by?
Step 4 of 6: Determine if the statement "Not all points
predicted by the linear model fall...
Step 1 of 6: Find the estimated Slope. Round your answer to
three decimal places.
Step 2 of 6: Find the estimated y-intercept. Round your answer
to three decimals places.
Step 3 of 6: According to the estimated linear model, if the
value of the independent variable is increased by one unit, then
the change in the dependent variable y^ is given by?
Step 4 of 6: Determine if the statement "Not all points
predicted by the linear model fall...
 Question 1 of 3, Step 6 of 6 4/18 Correct The table below gives the list price and the number of bids received for five randomly selected items sold through online auctions. Using this data, consider the equation of the regression line, ŷ = bo + bix, for predicting the number of bids an item will receive based on the list price. Keep in mind, the correlation coefficient may or may not be statistically significant for the data given. Remember,...
 Question 2 - of 24 Step 1 of 6 02:46:10 The table below gives the list price and the number of bids received for five randomly selected items sold through online auctions. Using this data. consider the equation of the regression line, y = bo + bx, for predicting the number of bids an item will receive based on the list price. Keep in mind, the correlation coefficient may or may not be statistically significant for the data given. Remember,...
Most questions answered within 3 hours.
-
A study of 420,095 cell phone users found that
134 of them developed cancer of the...
asked 21 seconds from now -
2.50 g of NH4Cl is added to 12.9 g of water. Calculate the
molality of the...
asked 2 minutes ago -
Part 1
(a) Calculate the pH at 25°C of a 0.10 M solution of a
weak...
asked 4 minutes ago -
1-Calculate the mass in grams of 2.55 moles of KCl
2- Calculate how many moles are...
asked 32 minutes ago -
Bright Sun, Inc. sold an issue of 30-year $1,000 par value bonds
to the public. The...
asked 26 minutes ago -
Bismuth-210 is beta emitter with a half-life of 5.0 days.
Part A
If a sample contains...
asked 18 minutes ago -
The income statement for the month of June, 2014 of Happy Smiles
Enterprises contains the following...
asked 31 minutes ago -
To be done in java code. 2 words are anagrams if 1 word can be
formed...
asked 29 minutes ago -
Two players take turns at removing 1 to 4 coins from an original
pile of 16...
asked 25 minutes ago -
1. Choose value for p between 0.20 and 0.80. It should have at
least two decimal...
asked 33 minutes ago -
QUESTIONS: 500 words for the question
In defining abnormality, the criteria of “deviance”, “distress”
and “dysfunction”...
asked 34 minutes ago -
A sample of n = 25 scores produces a t statistic of t =
-2.062. If...
asked 52 minutes ago