
Homework Answers


Add Answer to:
The average duration of labor from the first contraction to the birth of the baby in...
The t statistic, the t distribution, and sample size The average duration of labor from the...
 The t statistic, the t distribution, and sample size
The average duration of labor from the first contraction to the birth of the baby in women over 35 who have not previously given birth and who did not use any pharmaceuticals is 16 hours. Suppose you have a sample of 35 women who exercise daily, and who have an average duration of labor of 16.9 hours and a sample variance of 39.7 hours. You want to test the hypothesis that...
The t statistic, the t distribution, and sample size
The average duration of labor from the first contraction to the birth of the baby in women over 35 who have not previously given birth and who did not use any pharmaceuticals is 16 hours. Suppose you have a sample of 35 women who exercise daily, and who have an average duration of labor of 16.9 hours and a sample variance of 39.7 hours. You want to test the hypothesis that...
Use the Distributions tool to look at the t distributions for different sample sizes. To do this,...
 Use the Distributions tool to look at the t distributions for different sample sizes. To do this, choose the Degrees of Freedom for the first sample size on the slider, and click the radio button with the single orange line. Move the orange vertical line to the right until the number below the orange line is located on the t statistic. The probability of getting that t statistic or one more extreme will appear in the bubble with the orange...
The average age at which adolescent girls reach their adult height is 16 years. Suppose you...
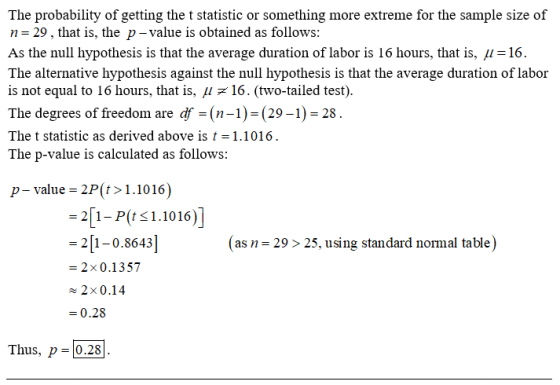
 The average age at which adolescent girls reach their adult height is 16 years. Suppose you have a sample of 29 adolescent girls who are developmentally delayed, and who have an average age at which they reached their adult height of 17.8 years and a sample variance of 77.4 years. You want to test the hypothesis that adolescent girls who are developmentally delayed have a different age at which they reached their adult height than all adolescent girls. Calculate the...
QUESTION 5 Which statement concerning the t-distribution is false? O AT follows a standard normal distribution...
 QUESTION 5 Which statement concerning the t-distribution is false? O AT follows a standard normal distribution OB. The smaller the degrees of freedom the flatter the curve. OC. The t-distribution has a larger standard deviation than the Standard Normal Curve. OD. T-distributions have a mean of 0. o E. The total area under the density curve depends on the degrees of freedom. QUESTION 6 The t-procedures are robust when A. sample size is 12 and the sample data is not...
1. Fill in the blank. In a one-sample t-test, we use the _________ to estimate...
1. Fill in the blank. In a one-sample t-test, we use the _________ to estimate the population standard deviation in order to calculate the standard error. How do you find the degrees of freedom (df) for a one-sample t-test? a. N b. Calculate the standard deviation of the sample c. n-2 d. n-1 Which of the following influences the likelihood of obtaining significant results? a. The larger your estimated standard error, the more likely it will be to get...
Attempts: Average: /10 ttestion Due th a bug in Googe Chrome. this page may not fuactioo...
 Attempts: Average: /10 ttestion Due th a bug in Googe Chrome. this page may not fuactioo correety Chcs heme learo 9. The t test for two independent samples - Two-tailed example Aa Aa Bullying," according to noted expert Dan Olweus, "poisons the educational environment and a every child." Bullying and victimization are evident as early as preschool, with the problem peaking Suppose you are interested in the emotional well-being of not only the victims but also bystanders, bullies, and those...
Question 14 --/1 View Policies Current Attempt in Progress Is a t-Distribution Appropriate? A sample with...
 Question 14 --/1 View Policies Current Attempt in Progress Is a t-Distribution Appropriate? A sample with size n = 10 has À = 508.5 , and S = 21.5 The dotplot for this sample is given below. TTTTTTTTTTTTTTTTTTTTTTTTTTT 540 550 560 570 500 510 520 530 Indicate whether or not it is appropriate to use the t-distribution. If it is appropriate, give the degrees of freedom for the t-distribution and give the estimated standard error. If it is not appropriate,...
Question 13 --/1 View Policies Current Attempt in Progress Is a t-Distribution Appropriate? A sample with size n= 18 ha...
 Question 13 --/1 View Policies Current Attempt in Progress Is a t-Distribution Appropriate? A sample with size n= 18 has = 87.9 , and s = 10.6 .The dotplot for this sample is given below. HOOOOO OOOO 00 of 60 70 80 100 Indicate whether or not it is appropriate to use the t-distribution. If it is appropriate, give the degrees of freedom for the t-distribution and give the estimated standard error. If it is not appropriate, enter -1 in...
Question 11 View Policies Current Attempt in Progress Is a t-Distribution Appropriate? A sample with size...
 Question 11 View Policies Current Attempt in Progress Is a t-Distribution Appropriate? A sample with size n = 12 has = 7.6 and s = 1.6 .The dotplot for this sample is given below. Oo O 10 11 7 Indicate whether or not it is appropriate to use the t-distribution. If it is appropriate, give the degrees of freedom for the t-distribution and give the estimated standard error. If it is not appropriate, enter -1 in both of the answer...
Question 12 --/1 View Policies Current Attempt in Progress Is a t-Distribution Appropriate? A sample with size n= 75 ha...
 Question 12 --/1 View Policies Current Attempt in Progress Is a t-Distribution Appropriate? A sample with size n= 75 has X = 18.92 , and s= 10.1 The dotplot for this sample is given below. OOOO 0000 0000 00000 OOOOO 00000 OOOOOOO 00000000000 00000000000 O OOO 00 00 0 0 10 20 30 40 Indicate whether or not it is appropriate to use the t-distribution. If it is appropriate, give the degrees of freedom for the t-distribution and give the...
 The t statistic, the t distribution, and sample size
The average duration of labor from the first contraction to the birth of the baby in women over 35 who have not previously given birth and who did not use any pharmaceuticals is 16 hours. Suppose you have a sample of 35 women who exercise daily, and who have an average duration of labor of 16.9 hours and a sample variance of 39.7 hours. You want to test the hypothesis that...
The t statistic, the t distribution, and sample size
The average duration of labor from the first contraction to the birth of the baby in women over 35 who have not previously given birth and who did not use any pharmaceuticals is 16 hours. Suppose you have a sample of 35 women who exercise daily, and who have an average duration of labor of 16.9 hours and a sample variance of 39.7 hours. You want to test the hypothesis that...
 Use the Distributions tool to look at the t distributions for different sample sizes. To do this, choose the Degrees of Freedom for the first sample size on the slider, and click the radio button with the single orange line. Move the orange vertical line to the right until the number below the orange line is located on the t statistic. The probability of getting that t statistic or one more extreme will appear in the bubble with the orange...
 The average age at which adolescent girls reach their adult height is 16 years. Suppose you have a sample of 29 adolescent girls who are developmentally delayed, and who have an average age at which they reached their adult height of 17.8 years and a sample variance of 77.4 years. You want to test the hypothesis that adolescent girls who are developmentally delayed have a different age at which they reached their adult height than all adolescent girls. Calculate the...
 QUESTION 5 Which statement concerning the t-distribution is false? O AT follows a standard normal distribution OB. The smaller the degrees of freedom the flatter the curve. OC. The t-distribution has a larger standard deviation than the Standard Normal Curve. OD. T-distributions have a mean of 0. o E. The total area under the density curve depends on the degrees of freedom. QUESTION 6 The t-procedures are robust when A. sample size is 12 and the sample data is not...
 Attempts: Average: /10 ttestion Due th a bug in Googe Chrome. this page may not fuactioo correety Chcs heme learo 9. The t test for two independent samples - Two-tailed example Aa Aa Bullying," according to noted expert Dan Olweus, "poisons the educational environment and a every child." Bullying and victimization are evident as early as preschool, with the problem peaking Suppose you are interested in the emotional well-being of not only the victims but also bystanders, bullies, and those...
 Question 14 --/1 View Policies Current Attempt in Progress Is a t-Distribution Appropriate? A sample with size n = 10 has À = 508.5 , and S = 21.5 The dotplot for this sample is given below. TTTTTTTTTTTTTTTTTTTTTTTTTTT 540 550 560 570 500 510 520 530 Indicate whether or not it is appropriate to use the t-distribution. If it is appropriate, give the degrees of freedom for the t-distribution and give the estimated standard error. If it is not appropriate,...
 Question 13 --/1 View Policies Current Attempt in Progress Is a t-Distribution Appropriate? A sample with size n= 18 has = 87.9 , and s = 10.6 .The dotplot for this sample is given below. HOOOOO OOOO 00 of 60 70 80 100 Indicate whether or not it is appropriate to use the t-distribution. If it is appropriate, give the degrees of freedom for the t-distribution and give the estimated standard error. If it is not appropriate, enter -1 in...
 Question 11 View Policies Current Attempt in Progress Is a t-Distribution Appropriate? A sample with size n = 12 has = 7.6 and s = 1.6 .The dotplot for this sample is given below. Oo O 10 11 7 Indicate whether or not it is appropriate to use the t-distribution. If it is appropriate, give the degrees of freedom for the t-distribution and give the estimated standard error. If it is not appropriate, enter -1 in both of the answer...
 Question 12 --/1 View Policies Current Attempt in Progress Is a t-Distribution Appropriate? A sample with size n= 75 has X = 18.92 , and s= 10.1 The dotplot for this sample is given below. OOOO 0000 0000 00000 OOOOO 00000 OOOOOOO 00000000000 00000000000 O OOO 00 00 0 0 10 20 30 40 Indicate whether or not it is appropriate to use the t-distribution. If it is appropriate, give the degrees of freedom for the t-distribution and give the...
Most questions answered within 3 hours.
-
The average length of time between arrivals at a turnpike
toll-booth is 26 seconds. What is...
asked 41 minutes ago -
(a) A piston at 6.1 atm contains a gas that occupies a volume of
3.5 L....
asked 1 hour ago -
Please answer true or false. Words
cannot be changed or added in to make it true...
asked 1 hour ago -
An empty test tube weighs 15.923 grams. Then,
MgCl2•6H2O is added into the test tube. After...
asked 1 hour ago -
Assume memory access is 10 units of time and disk access is
10000 units of time....
asked 2 hours ago -
1. Are all good samples random?
2. Magazines often report surveys giving statistics such as “63%...
asked 2 hours ago -
Under all the various types of market structures, firms
must eventually earn some economic profits for...
asked 2 hours ago -
Consider the following fitness regime for a single locus trait
with two co-dominant alleles: w11 =...
asked 2 hours ago -
A large cable company reports the following.
80% of its customers subscribe to its cable TV...
asked 2 hours ago -
Please answer the question in brief.
Discuss the role of ERP in organizations. Are ERP tools...
asked 2 hours ago -
Discuss the pros and cons of collaborative software such
as SameTime. Does it increase productivity? What...
asked 2 hours ago -
Buying your in-laws a gift because it’s expected is
due to the ____________ motive of gift-giving....
asked 2 hours ago