
Homework Answers
| Sample | n.p | p = n.p / 100 |
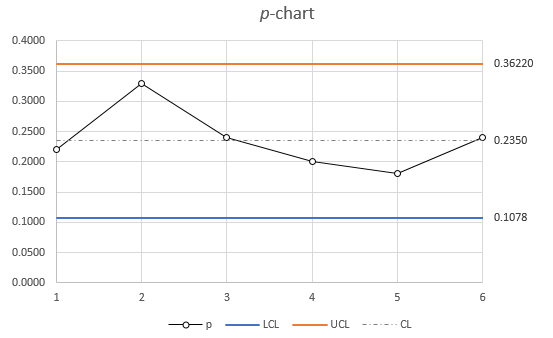
| 1 | 22 | 0.2200 |
| 2 | 33 | 0.3300 |
| 3 | 24 | 0.2400 |
| 4 | 20 | 0.2000 |
| 5 | 18 | 0.1800 |
| 6 | 24 | 0.2400 |
| Average | 0.2350 | |
The average proportion defective (p_bar) = 0.235
Std. Error (Sp) = (p_bar * (1 - p_bar) / n)1/2 = sqrt(0.235*(1 - 0.235)/100) = 0.0424
UCLp = p_bar + 3 *
Sp = 0.235 + 3 * 0.0424 =
0.3622
LCLp = Max(0, p_bar - 3 *
Sp)= Max(0, 0.235 - 3 * 0.0424) =
0.1078
Add Answer to:
(Chapter 6) A team in an accounting group has been working on improving the processing of...
A large certified public accounting firm has been monitoring the accuracy of its employees and wishes...
 A large certified public accounting firm has been monitoring the accuracy of its employees and wishes to get the number of accounts with errors under statistical control. It has sampled 100 accounts for each of the last 30 days and has examined them for errors, with the results shown in the accompanying data. Complete parts a through c below. Click the icon to view the counts for accounts with errors. a. Construct a p-chart for the account process. Choose the...
Aitehicles at one location keeps track of the mumber out- of service each day (see VEHICLE)....
 Aitehicles at one location keeps track of the mumber out- of service each day (see VEHICLE). Out of service is use for four or more hours Number Out of Service Proportionn 248 0.004 248 10 0.012 248 0.008 0024 248 15 16 0.032 19 0.016 the centerline and control limits for the appropriate control chart b. Are there any indications of a lack o a lack of control? onstant 224 Part Two Tools and Meshods olytc Sis Exercises afcturer of...
 A large certified public accounting firm has been monitoring the accuracy of its employees and wishes to get the number of accounts with errors under statistical control. It has sampled 100 accounts for each of the last 30 days and has examined them for errors, with the results shown in the accompanying data. Complete parts a through c below. Click the icon to view the counts for accounts with errors. a. Construct a p-chart for the account process. Choose the...
 Aitehicles at one location keeps track of the mumber out- of service each day (see VEHICLE). Out of service is use for four or more hours Number Out of Service Proportionn 248 0.004 248 10 0.012 248 0.008 0024 248 15 16 0.032 19 0.016 the centerline and control limits for the appropriate control chart b. Are there any indications of a lack o a lack of control? onstant 224 Part Two Tools and Meshods olytc Sis Exercises afcturer of...
Most questions answered within 3 hours.
-
i need help on this
Chapter 9 Section 3 Question 1:
Rudy puts this poster, with...
asked 4 minutes ago -
True or false Assembly x86
41. _____ The program counter is a pointer to the
instruction....
asked 5 minutes ago -
You have conducted an experiment to try to demonstrate that
growth factor receptor X protein (GFRX)...
asked 20 minutes ago -
The Gross Profit ratio for 2014 is 57.07%
Assume that Campbell's net sales for the first...
asked 20 minutes ago -
Thoroughly discuss the various current and proposed solutions to
anthropogenic influences resulting in Global Climate Change....
asked 24 minutes ago -
BLOG EXERCISE: You are writing a weekly intranet blog for the
CEO of a large Canadian...
asked 27 minutes ago -
calculate ΔGrxn at 36 ∘C. N2O4(g)→2NO2(g)
asked 27 minutes ago -
Present and Future Values of Single Cash Flows for Different
Periods
Find the following values, using...
asked 30 minutes ago -
Which types of mutations in DNA can lead to the translation of a
non-functional protein product?...
asked 29 minutes ago -
Many structures are composed of individual elements that react
in unison when forces are applied. the...
asked 31 minutes ago -
Work of 1950 J is done by stirring a perfectly insulated beaker
containing 75 g of...
asked 1 hour ago -
The neighborhood kids set up an outdoor lemonade stand in
Maryland in June. They find that...
asked 1 hour ago