
Homework Answers
Add Answer to:
1. The following are the values of waiting time of 6 customers of a city bank...
1. The following are the values of waiting time of 6 customers of a city bank...
 1. The following are the values of waiting time of 6 customers of a city bank in minutes β, 5, 6, 6, 8, 9 Find mean and stanidará deviations using the formula: n(n-1)
1. The following are the values of waiting time of 6 customers of a city bank...
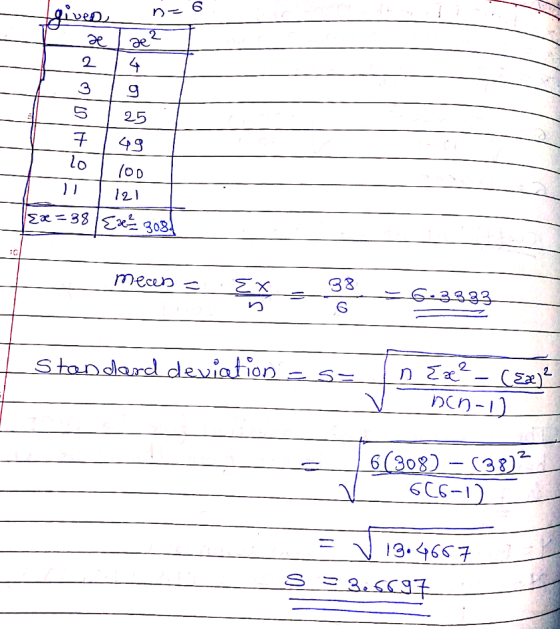
 1. The following are the values of waiting time of 6 customers of a city bank in minutes 3, 5, 6, 6, 8, 9 Find mean and standard deviations using the formula: 2 n(n-1) 2. You have drawn a card from a fully shuffled deck of 52 ordinary playing cards. Find the probabilities Clot b a. P(King or Red)- b. P (Heart or Queen) C. P (Below 5/not Ace)- d. P (Above&/ not Face)- e. P Red / Face 3....
6) The YourMoney Bank claims that the mean waiting time of customers for service at the...
6) The YourMoney Bank claims that the mean waiting time of customers for service at the drive through window is 3 minutes. a) State the Hypothesis to show the mean waiting time for service different than 3 minutes. b) Choose a level of a. Use a= 0.05 for this problem. c) To test the hypothesis, the quality-assurance department took a sample of 50 customers and records their waiting time in minutes. The data appear in the YourMoney worksheet of the...
The Burger Dome waiting line model studies the waiting time of customers at its fast-food restaurant....
 The Burger Dome waiting line model studies the waiting time of customers at its fast-food restaurant. Burger Dome's single-server waiting line system has an arrival rate of 0.75 customers per minute and a service rate of 1 customer per minute. Adapt the Black Sheep Scarves spreadsheet shown below to simulate the operation of this waiting line. Make sure to use the random values for both interarrival and service times generated in the worksheet_12-23. Assuming that customer arrivals follow a Poisson...
Sherry is a bank manager and wants to improve the time customers spend on waiting in...
Sherry is a bank manager and wants to improve the time customers spend on waiting in the lobby for services. she has a large sample of 125 customers. the sample average waiting time (mean) is 11 minutes and s = 4 minutes. she wants to be able to claim that average waiting time is less then 12 minutes. plesse help her test with a=0.02 with this large sample. Step 1 Step 2 Step 3 Step 4. Please tell me if...
4. The values listed are waiting times (in minutes) of customers at the Jefferson Bank., where...
 4. The values listed are waiting times (in minutes) of customers at the Jefferson Bank., where customers enter a single waiting line that feeds three teller windows. Find the critical values 2 and z corresponding to a 95% confidence level. 6.5 6.6 6.7 6.8 7.1 7.3 7.4 7.7 7.7 7.7 O 3.325, 16.919 O 2.700, 19.023 O 3.247, 20.483 O1.237, 14.449 5. Find the 99% confidence interval for the population standard deviation given the following, (1 point) n-17, R 472,s...
26. A bank claims that the mean waiting time in line is less than 2.2 minutes....
 26. A bank claims that the mean waiting time in line is less than 2.2 minutes. A randoms ample of 20 customers has a mean of 2 minutes with a standard deviation of 0.8 minute. If a 0.05, test t banks claim using the classical method and P-values! You must show all work and you found your values. This includes showing any formulas used! Give an interpretation as well show how
lues listed are waiting times (in minutes) of customers at the Jeffterson Bank, where (1 pomt)...
 lues listed are waiting times (in minutes) of customers at the Jeffterson Bank, where (1 pomt) customers enter a single waiting line that feeds three teller windows. Find the critical values 21 and 2 corresponding to a 95% confidence level 65 6.6 6.7 6.8 7.1 73 74 77 7.7 77 3.325, 16.919 2.700, 19.023 3247, 20483 1.237, 14.449 5. Given a sample size of 20, what are the critical values 22 and for a 95% confidence level? (1 point) 8.907,...
1. Recall that a bank manager has developed a new system to reduce the time customers...
1. Recall that a bank manager has developed a new system to reduce the time customers spend waiting for teller service during peak hours. The manager hopes the new system will reduce waiting times from the current 9 to 10 minutes to less than 6 minutes. Suppose the manager wishes to use the random sample of 100 waiting times to support the claim that the mean waiting time under the new system is shorter than six minutes. a. Letting μ...
1. Recall that a bank manager has developed a new system to reduce the time customers...
 1. Recall that a bank manager has developed a new system to reduce the time customers spend waiting to be served by tellers during peak business hours. The mean waiting time during peak business hours under the current system is roughly 9 to 10 minutes. The bank manager hopes that the new system will have a mean waiting time that is less than six minutes. The mean of the sample of 100 bank customer waiting times in Table 1.9 is...
 1. The following are the values of waiting time of 6 customers of a city bank in minutes β, 5, 6, 6, 8, 9 Find mean and stanidará deviations using the formula: n(n-1)
 1. The following are the values of waiting time of 6 customers of a city bank in minutes 3, 5, 6, 6, 8, 9 Find mean and standard deviations using the formula: 2 n(n-1) 2. You have drawn a card from a fully shuffled deck of 52 ordinary playing cards. Find the probabilities Clot b a. P(King or Red)- b. P (Heart or Queen) C. P (Below 5/not Ace)- d. P (Above&/ not Face)- e. P Red / Face 3....
 The Burger Dome waiting line model studies the waiting time of customers at its fast-food restaurant. Burger Dome's single-server waiting line system has an arrival rate of 0.75 customers per minute and a service rate of 1 customer per minute. Adapt the Black Sheep Scarves spreadsheet shown below to simulate the operation of this waiting line. Make sure to use the random values for both interarrival and service times generated in the worksheet_12-23. Assuming that customer arrivals follow a Poisson...
 4. The values listed are waiting times (in minutes) of customers at the Jefferson Bank., where customers enter a single waiting line that feeds three teller windows. Find the critical values 2 and z corresponding to a 95% confidence level. 6.5 6.6 6.7 6.8 7.1 7.3 7.4 7.7 7.7 7.7 O 3.325, 16.919 O 2.700, 19.023 O 3.247, 20.483 O1.237, 14.449 5. Find the 99% confidence interval for the population standard deviation given the following, (1 point) n-17, R 472,s...
 26. A bank claims that the mean waiting time in line is less than 2.2 minutes. A randoms ample of 20 customers has a mean of 2 minutes with a standard deviation of 0.8 minute. If a 0.05, test t banks claim using the classical method and P-values! You must show all work and you found your values. This includes showing any formulas used! Give an interpretation as well show how
 lues listed are waiting times (in minutes) of customers at the Jeffterson Bank, where (1 pomt) customers enter a single waiting line that feeds three teller windows. Find the critical values 21 and 2 corresponding to a 95% confidence level 65 6.6 6.7 6.8 7.1 73 74 77 7.7 77 3.325, 16.919 2.700, 19.023 3247, 20483 1.237, 14.449 5. Given a sample size of 20, what are the critical values 22 and for a 95% confidence level? (1 point) 8.907,...
 1. Recall that a bank manager has developed a new system to reduce the time customers spend waiting to be served by tellers during peak business hours. The mean waiting time during peak business hours under the current system is roughly 9 to 10 minutes. The bank manager hopes that the new system will have a mean waiting time that is less than six minutes. The mean of the sample of 100 bank customer waiting times in Table 1.9 is...
Most questions answered within 3 hours.
-
Minitab Problem: Take the Lake Hume June rainfall data and find
use the processes outlined in...
asked 34 minutes ago -
X Company is trying to decide whether to continue using old
equipment to make Product A...
asked 35 minutes ago -
IN PYTHON ONLY !! Program 2: Re-work
program #5 (WeeklyHours) from the previous assignment such that...
asked 1 hour ago -
The average length of time between arrivals at a turnpike
toll-booth is 26 seconds. What is...
asked 2 hours ago -
(a) A piston at 6.1 atm contains a gas that occupies a volume of
3.5 L....
asked 4 hours ago -
Please answer true or false. Words
cannot be changed or added in to make it true...
asked 4 hours ago -
An empty test tube weighs 15.923 grams. Then,
MgCl2•6H2O is added into the test tube. After...
asked 4 hours ago -
Assume memory access is 10 units of time and disk access is
10000 units of time....
asked 4 hours ago -
1. Are all good samples random?
2. Magazines often report surveys giving statistics such as “63%...
asked 4 hours ago -
Under all the various types of market structures, firms
must eventually earn some economic profits for...
asked 4 hours ago -
Consider the following fitness regime for a single locus trait
with two co-dominant alleles: w11 =...
asked 4 hours ago -
A large cable company reports the following.
80% of its customers subscribe to its cable TV...
asked 4 hours ago