The table below gives the number of parking tickets received in one semester and the GPA...
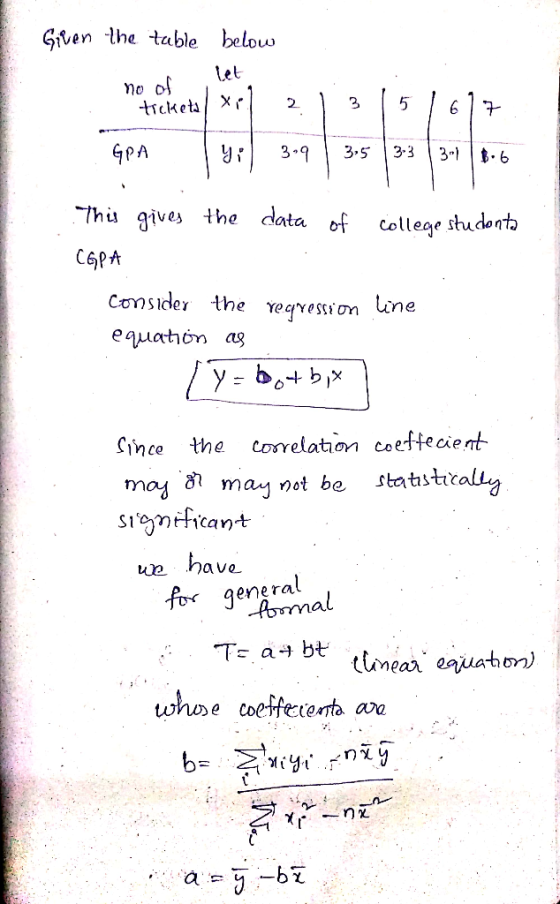
The table below gives the number of parking tickets received in one semester and the GPA for five randomly selected college students who drive to campus. Using this data, consider the equation of the regression line y^=b0+b1x , for predicting the GPA of a college student who drives to campus based on the number of parking tickets they receive in one semester. Keep in mind, the correlation coefficient may or may not be statistically significant for the data given. Remember, in practice, it would not be appropriate to use the regression line to make a prediction if the correlation coefficient is not statistically significant.
| Number of Tickets | 2 | 3 | 5 | 6 | 7 |
|---|---|---|---|---|---|
| GPA | 3.9 | 3.5 | 3.3 | 3.1 | 1.6 |
Step 1 of 6 :
Find the estimated slope. Round your answer to three decimal places.
Homework Answers


Add Answer to:
The table below gives the number of parking tickets received in
one semester and the GPA...
The table below gives the number of parking tickets received in one semester and the GPA...
 The table below gives the number of parking tickets received in one semester and the GPA for five randomly selected college students who drive to campus. Using this data, consider the equation of the repression line y bo + bix. for predicting the GPA of a college student who drives to campus based on the number of parking tickets they receive in one semester. Keep in mind, the correlation coefficient may or may not be statistically significant for the data...
The table below gives the number of parking tickets received in one semester and the GPA...
The table below gives the number of parking tickets received in one semester and the GPA for five randomly selected college students who drive to campus. Using this data, consider the equation of the regression line, yˆ=b0+b1x , for predicting the GPA of a college student who drives to campus based on the number of parking tickets they receive in one semester. Keep in mind, the correlation coefficient may or may not be statistically significant for the data given. Remember,...
The table below gives the list price and the number of bids received for five randomly...
The table below gives the list price and the number of bids received for five randomly selected items sold through online auctions. Using this data, consider the equation of the regression line, yˆ=b0+b1xy^=b0+b1x, for predicting the number of bids an item will receive based on the list price. Keep in mind, the correlation coefficient may or may not be statistically significant for the data given. Remember, in practice, it would not be appropriate to use the regression line to make...
The table below gives the list price and the number of bids received for five randomly...
The table below gives the list price and the number of bids received for five randomly selected items sold through online auctions. Using this data, consider the equation of the regression line, yˆ=b0+b1x, for predicting the number of bids an item will receive based on the list price. Keep in mind, the correlation coefficient may or may not be statistically significant for the data given. Remember, in practice, it would not be appropriate to use the regression line to make...
The table below gives the number of hours spent unsupervised each day as well as the...
The table below gives the number of hours spent unsupervised each day as well as the overall grade averages for seven randomly selected middle school students. Using this data, consider the equation of the regression line. y = b0 + b1x. for predicting the overall grade average for a middle school student based on the number of hours spent unsupervised each day. Keep in mind, the correlation coefficient may or may not be statistically significant for the data given. Remember,...
The table below gives the age and bone density for five randomly selected women. Using this...
The table below gives the age and bone density for five randomly selected women. Using this data, consider the equation of the regression line, yˆ=b0+b1xy^=b0+b1x, for predicting a woman's bone density based on her age. Keep in mind, the correlation coefficient may or may not be statistically significant for the data given. Remember, in practice, it would not be appropriate to use the regression line to make a prediction if the correlation coefficient is not statistically significant. Age 5050 5959...
 The table below gives the number of parking tickets received in one semester and the GPA for five randomly selected college students who drive to campus. Using this data, consider the equation of the repression line y bo + bix. for predicting the GPA of a college student who drives to campus based on the number of parking tickets they receive in one semester. Keep in mind, the correlation coefficient may or may not be statistically significant for the data...
Most questions answered within 3 hours.
-
Write a program to solve the Josephus problem, with the following
modification:
Sample Input:
./a.out n...
asked 2 hours ago -
At the start of a CD it is spinning at a rate of 525 rpm
(revolutions...
asked 3 hours ago -
4. Without doing any calculations, predict whether the observed
∆T would increase, decrease or remain the...
asked 4 hours ago -
Based on the range, which of the following sets of scores has
the greatest variability? 3,...
asked 5 hours ago -
Ripples in a pond travel at a velocity of 3 m/s with one peak
passing a...
asked 5 hours ago -
A man stands on the roof of a building of height 13.0 mm and
throws a...
asked 5 hours ago -
The extent to which assets are financed by borrowed funds and
other liabilities is indicated by:...
asked 6 hours ago -
Explain in detail
Germany is the fifth largest economy
explain what goods and services Germany specializes...
asked 6 hours ago -
The density of platinum is 21.45 g/mL. If a cube of platinum
with a mass of...
asked 6 hours ago -
Accounts Receivable
Sales
A/R Posting
Extended Sales Invoice
Packing Slip
Compare invoice to packing slip 2...
asked 6 hours ago -
Michaella, age 23, is a full-time law student and is claimed by
her parents as a...
asked 6 hours ago -
Why are polymers not typically casted into products?
asked 7 hours ago