
Homework Answers

Add Answer to:
The data from a standard Proctor test are shown in the table below. a) Determine the...
The data from a standard Proctor test are shown in the table below. a) Determine the...
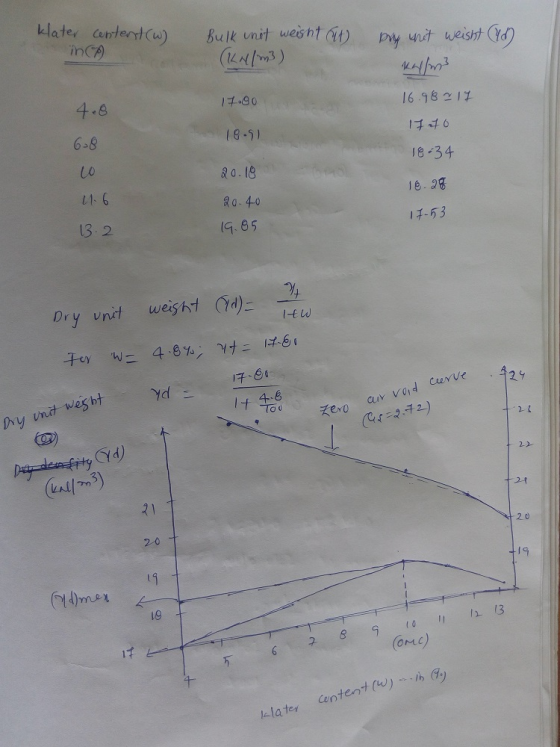
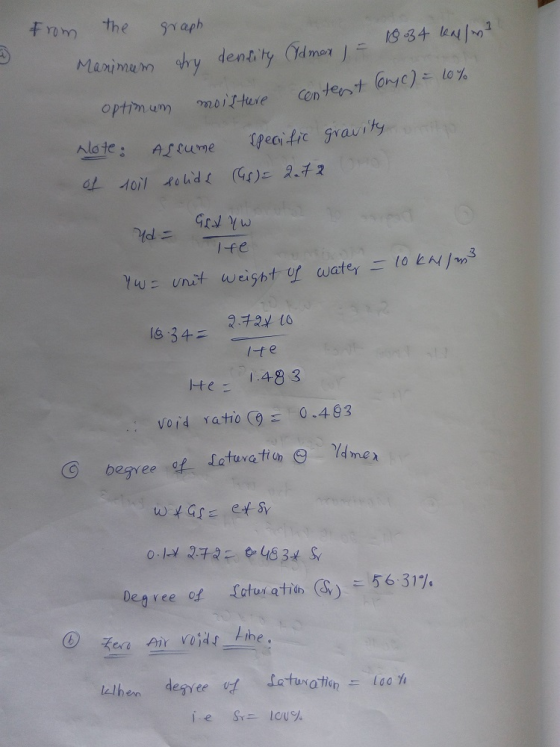
 The data from a standard Proctor test are shown in the table below. a) Determine the maximum dry unit weight and the optimum water content. b) Plot the zero air voids line. c) Determine the degree of saturation at the maximum dry unit weight. Mass of Mass of Mass of Mass of Water Mass of | Bulk wet soil can and can and can and mold wet soil dry soil content wet soil unit grams) (%) (grams) | weight (g)...
Q3. The data from a standard Proctor test are shown in the table belovw (a) Determine...
 Q3. The data from a standard Proctor test are shown in the table belovw (a) Determine the maximum dry unit weight and the optimum water content. (b) Plot the zero air voids line. (c) Determine the degree of saturation at the maximum dry unit weight. Diameter of mould 101.4 mm Height of mould 116.7 mm Mass of mould 4196.50 grams Specific gravity, Gs 2.69 Unit weight determination Water content determination Mass of can and wet soil Mass of can and...
The following data were obtained from a Proctor test: 12 13 19 Water content (%) Weight...
 The following data were obtained from a Proctor test: 12 13 19 Water content (%) Weight of wet sample (N) 14 18.7 16 19.3 17 18 18.9 The volume of the mold was 9.44 x 10⁻⁴m3. (a) Determine the optimum water content and maximum dry unit weight. (b) Plot the zero air voids line. (c) Determine the degree of saturation at the maximum dry unit weight.
The following results were obtained from standard Proctor compaction tests. Test ID Mass of moist soil...
 The following results were obtained from standard Proctor compaction tests. Test ID Mass of moist soil (kg) 1 1.633 Standard Proctor Test 2 . 1.841 1.907 1.822 1.756 Moisture Content Test 14 14 Mass of tin empty (g) Mass of tin + wet sample (g) Mass of tin + dry sample (g) 98 62 878280 (a) Calculate moisture content (w) and dry unit weight (ya) for standard Proctor compaction tests. Plot moisture content (w) vs. dry unit weight (yd). Given:...
Standard Proctor Test results are shown in the table below. Accordingly, graph the chart and determine...
 Standard Proctor Test results are shown in the table below. Accordingly, graph the chart and determine the optimum water content and maximum dry unit volume weight. Kabin Macmi (cm3) 9499 Deney Başındak Kabın içindeki Zemin Airhugo () 1675 1950 2060 1970 Kap No 42 39 38 66 64 44 Kap+Islak Zemin Apr (e) 136,4 1249 1232 113 121,3 148,9 177,3 Kap+Kuru Zemin Airline) 128,7 113,7 111,8 99 105,9 125,4 1491 Kabin Agrh (B) 23,5 26,9 23,2 23,3 23 22,6 24.4...
 The data from a standard Proctor test are shown in the table below. a) Determine the maximum dry unit weight and the optimum water content. b) Plot the zero air voids line. c) Determine the degree of saturation at the maximum dry unit weight. Mass of Mass of Mass of Mass of Water Mass of | Bulk wet soil can and can and can and mold wet soil dry soil content wet soil unit grams) (%) (grams) | weight (g)...
 Q3. The data from a standard Proctor test are shown in the table belovw (a) Determine the maximum dry unit weight and the optimum water content. (b) Plot the zero air voids line. (c) Determine the degree of saturation at the maximum dry unit weight. Diameter of mould 101.4 mm Height of mould 116.7 mm Mass of mould 4196.50 grams Specific gravity, Gs 2.69 Unit weight determination Water content determination Mass of can and wet soil Mass of can and...
 The following data were obtained from a Proctor test: 12 13 19 Water content (%) Weight of wet sample (N) 14 18.7 16 19.3 17 18 18.9 The volume of the mold was 9.44 x 10⁻⁴m3. (a) Determine the optimum water content and maximum dry unit weight. (b) Plot the zero air voids line. (c) Determine the degree of saturation at the maximum dry unit weight.
 The following results were obtained from standard Proctor compaction tests. Test ID Mass of moist soil (kg) 1 1.633 Standard Proctor Test 2 . 1.841 1.907 1.822 1.756 Moisture Content Test 14 14 Mass of tin empty (g) Mass of tin + wet sample (g) Mass of tin + dry sample (g) 98 62 878280 (a) Calculate moisture content (w) and dry unit weight (ya) for standard Proctor compaction tests. Plot moisture content (w) vs. dry unit weight (yd). Given:...
 Standard Proctor Test results are shown in the table below. Accordingly, graph the chart and determine the optimum water content and maximum dry unit volume weight. Kabin Macmi (cm3) 9499 Deney Başındak Kabın içindeki Zemin Airhugo () 1675 1950 2060 1970 Kap No 42 39 38 66 64 44 Kap+Islak Zemin Apr (e) 136,4 1249 1232 113 121,3 148,9 177,3 Kap+Kuru Zemin Airline) 128,7 113,7 111,8 99 105,9 125,4 1491 Kabin Agrh (B) 23,5 26,9 23,2 23,3 23 22,6 24.4...
Most questions answered within 3 hours.
-
1a) According to the ideal gas law, _______________.
a. a gas has infinite volume at absolute...
asked 21 minutes ago -
Oakdale Fashions, Inc. had $245,000 in 2018 taxable income.
Using the tax schedule in Table 2.3...
asked 45 minutes ago -
The marketing class at CSUS had an average score of 150. An
educational analyst determined that...
asked 2 hours ago -
Justin Case has purchased a $250 000 home by putting 20 % down
and taking out...
asked 2 hours ago -
1. In a labor market, marginal cost for a firm is
____________.
a. recruiting cost
b....
asked 2 hours ago -
On January 1, 2019, ABC Company issued $60,000,000 of 20-year,
10.5% bonds when the market rate...
asked 3 hours ago -
39.4% of US homes continue to use a landline in addition to cell
phone service. 3...
asked 3 hours ago -
Starting with benzene, synthesize 1-phenyl-1-butyne.
Show intermediates and reagents.
asked 4 hours ago -
Create a 32-run crossed array design with six control factors
and two noise factors such that...
asked 5 hours ago -
A 500g sample of sand from source A has the following amounts
retained on each sieve....
asked 5 hours ago -
In
your own words, please explain the essay by John Keynes wrote "The
End of Laissez...
asked 5 hours ago -
How are the matrix and pixels related? Why are smaller
pixels better for diagnostic quality?
asked 5 hours ago