ANSWERS AND GRAPHS MUST BE CLEAR TO READ!

Mylan will earn POSITIVE, ZERO, NEGATIVE PROFIT??
Homework Answers
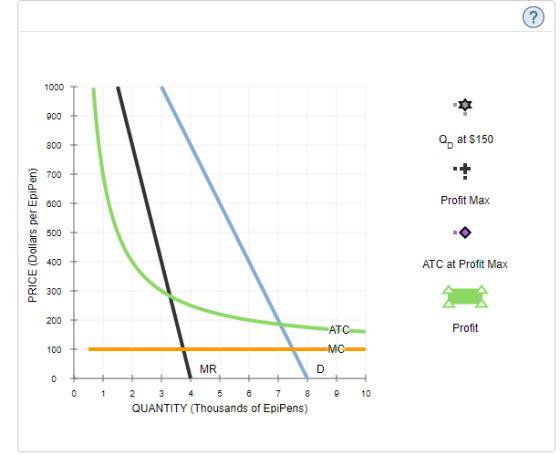
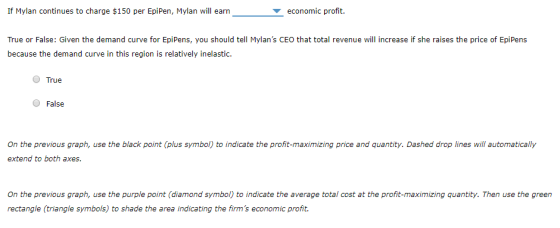
(a) When Price = $150, ATC curve corresponding to QD lies above demand curve, so price is lower than ATC and Mylan will earn Negative economic profit.

(b) True
Demand curve is inelastic in the portion from mid-point of demand curve (Q = 4,000) to the right of demand curve (upto Q = 8,000). In this elastic range, higher price will increase revenue.
(c) Profit is maximized at intersection of MR and MC curves, as shown in above graph.
Add Answer to:
ANSWERS AND GRAPHS MUST BE CLEAR TO READ!
Mylan will earn POSITIVE, ZERO, NEGATIVE
PROFIT??
2....
Homework (Ch 09) Suppose that a firm produces tennis racquets in a monopolistically competitive market. The follow...
 Suppose that a firm produces tennis racquets in a monopolistically competitive market. The following graph shows its demand curve (D), marginal revenue curve (MR), marginal cost curve (MC), and long-run average cost curve (LRAC). Assume that all firms in the industry face the same cost structure.Place the tan point (dash symbol) on the graph to indicate the long-run monopolistically competitive equmbrium price and quantity for this firm. Next, place the purple point (diamond symbol) to indicate the point at which...
Profit maximization of a seller in a competitive price-searchermarket 2. Consider De Virtuose Cupcake, a cupcake...
 2. Profit maximization of a seller in a competitive price-searchermarket Consider De Virtuose Cupcake, a cupcake shop in a competitive price-searcher market. The following graph shows its demand curve, marginal revenue (MR) curve, marginal cost (MC) curve, and average total cost (ATC) curve. Assume that the shop is operating in the short run. Place the black point (plus symbol) on the graph to indicate the profit-maximizing price and quantity. If the shop is making a profit, use the green rectangle (triangle symbols)...
Possible Answers 1: Earn zero profit, Earn positive profit, shut down, operate at a loss 2: Enter, Exit, Neither 3:Zero...
 Possible Answers
1: Earn zero profit, Earn positive profit, shut down, operate at
a loss
2: Enter, Exit, Neither
3:Zero, Positive, Negative
4:10,15,20
Consider the perfectly competitive market for copper. Assume that, regardless of how many firms are in the industry, every firm in the industry is identical and faces the marginal cost (MC), average cost (AC), and average variable cost (AVC) curves shown on the following graph. 100 90 80 70 60 50 40 AC 30 20 AVC MC...
Possible Answers
1: Earn zero profit, Earn positive profit, shut down, operate at
a loss
2: Enter, Exit, Neither
3:Zero, Positive, Negative
4:10,15,20
Consider the perfectly competitive market for copper. Assume that, regardless of how many firms are in the industry, every firm in the industry is identical and faces the marginal cost (MC), average cost (AC), and average variable cost (AVC) curves shown on the following graph. 100 90 80 70 60 50 40 AC 30 20 AVC MC...
Consider the perfectly competitive market for sports jackets. The following graph shows the marginal cost (MC),...
 Consider the perfectly competitive market for sports jackets. The following graph shows the marginal cost (MC), average total cost (ATC), and average variable cost (AVC) curves for a typical firm in the industry. For each price in the following table, use the graph to determine the number of jackets this firm would produce in order to maximize its profit. Assume that when the price is exactly equal to the average variable cost, the firm is indifferent between producing zero jackets and...
9. The logic of price discrimination Aa Aa Consider the market for airline tickets on Trans-America...
 9. The logic of price discrimination Aa Aa Consider the market for airline tickets on Trans-America Airlines from Los Angeles to Philadelphia. The following graph shows the demand curve, marginal revenue (MR) curve, and marginal cost (MC) curve for this particular flight In particular, the cost of adding another passenger to an otherwise empty seat is constant at $80. For simplicity, assume throughout this question that there are no supply constraints owing to seating capacity and assume that there are...
PLEASE READ VERY CAREFULLY!! ANSWERS MUST BE CORRECT AND CLEAR TO READ. AND FOR THE GRAPH...
 PLEASE READ VERY CAREFULLY!! ANSWERS MUST BE CORRECT AND CLEAR
TO READ. AND FOR THE GRAPH PLEASE LIST OUT ALL THE COORDINATE
POINTS!! THANKS!
PRODUCE OR SHUTDOWN OPTIONS"
EITHER SHUT DOWN OR PRODUCE
PRODUCE
SHUTDOWN
IN THE LONG RUN: FIRMS WILL NEITHER ENTER NOR
EXIT
SOME FIRMS WILL ENTER
SOME SOME FIRMS WILL EXIT
5. Deriving the short-run supply curve Consider the price-taker market for dress shirts. The following graph shows the marginal cost (MC), average total cost (ATC), and...
PLEASE READ VERY CAREFULLY!! ANSWERS MUST BE CORRECT AND CLEAR
TO READ. AND FOR THE GRAPH PLEASE LIST OUT ALL THE COORDINATE
POINTS!! THANKS!
PRODUCE OR SHUTDOWN OPTIONS"
EITHER SHUT DOWN OR PRODUCE
PRODUCE
SHUTDOWN
IN THE LONG RUN: FIRMS WILL NEITHER ENTER NOR
EXIT
SOME FIRMS WILL ENTER
SOME SOME FIRMS WILL EXIT
5. Deriving the short-run supply curve Consider the price-taker market for dress shirts. The following graph shows the marginal cost (MC), average total cost (ATC), and...
The following graph shows the demand (D) for gas services in the imaginary town of Utilityburg
 2. Natural monopoly analysis The following graph shows the demand (D) for gas services in the imaginary town of Utilityburg. The graph also shows the marginal revenue (MR) curve, the marginal cost (MC) curve, and the average total cost (ATC) curve for the local gas company, a natural monopolist. On the following graph, use the black point (plus symbol) to indicate the profit maximizing price and quantity for this natural monopolist.
Place the black point (plus symbol) on the following graph to indicate the profit-maximizing price and quantity for BYOB.
 Place the black point (plus symbol) on the following graph to indicate the profit-maximizing price and quantity for BYOB. If BYOB is making a profit, use the green rectangle (triangle symbols) to shade in the area representing its profit. On the other hand, if BYOB is suffering a loss, use the purple rectangle (diamond symbols) to shade in the area representing the loss. Suppose that BYOB charges $2.00 per can. Your friend Jake says that since BYOB is a monopoly with...
2. Cournot competition Aa Aa Consider a town in which only two residents, Sam and Amy,...
 2. Cournot competition Aa Aa Consider a town in which only two residents, Sam and Amy, own wells that produce water safe for drinking. Sam and Amy can pump and sell as much water as they want at no cost. Assume that outside water cannot be transported into the town for sale. The following questions will walk you through how to compute the Cournot quantity competition outcome for these duopolists. Consider the market demand curve for water and the marginal...
Consider the competitive market for halogen lamps. The following graph shows the marginal cost (MC), average total cost (ATC), and average variable cost (AVC) curves for a typical firm in the industry.
 Consider the competitive market for halogen lamps. The following graph shows the marginal cost (MC), average total cost (ATC), and average variable cost (AVC) curves for a typical firm in the industry. For each price in the following table, use the graph to determine the number of lamps this firm would produce in order to maximize its profit. Assume that when the price is exactly equal to the average variable cost, the firm is indifferent between producing zero lamps and the...
 Possible Answers
1: Earn zero profit, Earn positive profit, shut down, operate at
a loss
2: Enter, Exit, Neither
3:Zero, Positive, Negative
4:10,15,20
Consider the perfectly competitive market for copper. Assume that, regardless of how many firms are in the industry, every firm in the industry is identical and faces the marginal cost (MC), average cost (AC), and average variable cost (AVC) curves shown on the following graph. 100 90 80 70 60 50 40 AC 30 20 AVC MC...
Possible Answers
1: Earn zero profit, Earn positive profit, shut down, operate at
a loss
2: Enter, Exit, Neither
3:Zero, Positive, Negative
4:10,15,20
Consider the perfectly competitive market for copper. Assume that, regardless of how many firms are in the industry, every firm in the industry is identical and faces the marginal cost (MC), average cost (AC), and average variable cost (AVC) curves shown on the following graph. 100 90 80 70 60 50 40 AC 30 20 AVC MC...
 9. The logic of price discrimination Aa Aa Consider the market for airline tickets on Trans-America Airlines from Los Angeles to Philadelphia. The following graph shows the demand curve, marginal revenue (MR) curve, and marginal cost (MC) curve for this particular flight In particular, the cost of adding another passenger to an otherwise empty seat is constant at $80. For simplicity, assume throughout this question that there are no supply constraints owing to seating capacity and assume that there are...
 PLEASE READ VERY CAREFULLY!! ANSWERS MUST BE CORRECT AND CLEAR
TO READ. AND FOR THE GRAPH PLEASE LIST OUT ALL THE COORDINATE
POINTS!! THANKS!
PRODUCE OR SHUTDOWN OPTIONS"
EITHER SHUT DOWN OR PRODUCE
PRODUCE
SHUTDOWN
IN THE LONG RUN: FIRMS WILL NEITHER ENTER NOR
EXIT
SOME FIRMS WILL ENTER
SOME SOME FIRMS WILL EXIT
5. Deriving the short-run supply curve Consider the price-taker market for dress shirts. The following graph shows the marginal cost (MC), average total cost (ATC), and...
PLEASE READ VERY CAREFULLY!! ANSWERS MUST BE CORRECT AND CLEAR
TO READ. AND FOR THE GRAPH PLEASE LIST OUT ALL THE COORDINATE
POINTS!! THANKS!
PRODUCE OR SHUTDOWN OPTIONS"
EITHER SHUT DOWN OR PRODUCE
PRODUCE
SHUTDOWN
IN THE LONG RUN: FIRMS WILL NEITHER ENTER NOR
EXIT
SOME FIRMS WILL ENTER
SOME SOME FIRMS WILL EXIT
5. Deriving the short-run supply curve Consider the price-taker market for dress shirts. The following graph shows the marginal cost (MC), average total cost (ATC), and...
 2. Cournot competition Aa Aa Consider a town in which only two residents, Sam and Amy, own wells that produce water safe for drinking. Sam and Amy can pump and sell as much water as they want at no cost. Assume that outside water cannot be transported into the town for sale. The following questions will walk you through how to compute the Cournot quantity competition outcome for these duopolists. Consider the market demand curve for water and the marginal...
Most questions answered within 3 hours.
-
Write a program to solve the Josephus problem, with the following
modification:
Sample Input:
./a.out n...
asked 2 hours ago -
At the start of a CD it is spinning at a rate of 525 rpm
(revolutions...
asked 2 hours ago -
4. Without doing any calculations, predict whether the observed
∆T would increase, decrease or remain the...
asked 4 hours ago -
Based on the range, which of the following sets of scores has
the greatest variability? 3,...
asked 5 hours ago -
Ripples in a pond travel at a velocity of 3 m/s with one peak
passing a...
asked 5 hours ago -
A man stands on the roof of a building of height 13.0 mm and
throws a...
asked 5 hours ago -
The extent to which assets are financed by borrowed funds and
other liabilities is indicated by:...
asked 6 hours ago -
Explain in detail
Germany is the fifth largest economy
explain what goods and services Germany specializes...
asked 6 hours ago -
The density of platinum is 21.45 g/mL. If a cube of platinum
with a mass of...
asked 6 hours ago -
Accounts Receivable
Sales
A/R Posting
Extended Sales Invoice
Packing Slip
Compare invoice to packing slip 2...
asked 6 hours ago -
Michaella, age 23, is a full-time law student and is claimed by
her parents as a...
asked 6 hours ago -
Why are polymers not typically casted into products?
asked 6 hours ago