


Homework Answers
a) use minitab to obtain the correlation matrix for the given data
MINITAB procedure :
step 1: selet star > basic statistics > correlation .
step 2: in variables, select sales, outlets, and Auto from the box
on the left.
step 3: click OK in all boxes.
MINITAB output :
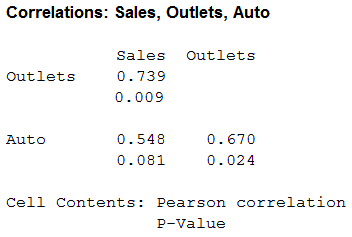
the correlation value for outlet is 0.739 and auto is 0.58 the correlation value of the independent variables 0.670.


Add Answer to:
The sales manager of a large automotive parts distributor wants to develop a model to forecast...
The 1-85 Carpet Outlet wants to develop a means to forecast its carpet sales manager believes hou...
 The 1-85 Carpet Outlet wants to develop a means to forecast its carpet sales manager believes housing starts in town. The manager has gathered data from coun that the store's sales are directly related to the number of new ty records of monthly ouse construction permits and from store records on monthly sales. These data are as follows: MONTHLY CARPET SALES (¡ooosyd) MONTHLY CONSTRUCİON PERMITS 5 12 30 14 5 10 14 20 16 31 16 a. Develop a linear...
Jim Royo, manager of Billings Building Supply (BBS), wants to develop a model to forecast BBS's...
 Jim Royo, manager of Billings Building Supply (BBS), wants to develop a model to forecast BBS's monthly sales (in $1,000's). He selects the dollar value of residential building permits (in $10,000) as the predictor variable. An analysis of the data yielded the following tables. Intercept Coefficients 222.1456 6.152885 Standard Error Statistic p-value 7 4.765 2.971252 0.007284 1 .895423 3.24618 0.003866 df SSMS p-value Regression 1259643.9 A B Residual 38492791.3 Total 39752435,2 Using a = 0.05, the critical value of the...
Question 4. Fatima also wants to reward the sales manager of the branch that has performed...
Question 4. Fatima also wants to reward the sales manager of the branch that has performed the best during the New Year week. She has selected the top three branches with the highest sales, and will conduct Analysis of Variance (ANOVA) on the data set. What will an ANOVA help her decide? Branch Sales (AED '000) Branch 1 43 39 55 56 73 Branch 2 55 58 66 79 82 Branch 3 61 66 85 86 91 Question 6:Fatima is...
Question 4. Fatima also wants to reward the sales manager of the branch that has performed the best during the New Year...
Question 4. Fatima also wants to reward the sales manager of the branch that has performed the best during the New Year week. She has selected the top three branches with the highest sales, and will conduct Analysis of Variance (ANOVA) on the data set. What will an ANOVA help her decide? Branch Sales (AED '000) Branch 1 43 39 55 56 73 Branch 2 55 58 66 79 82 Branch 3 61 66 85 86 91 Question 6:Fatima is...
The maintenance manager at a trucking company wants to build a regression model to forecast the t...
 The maintenance manager at a trucking company wants to build a regression model to forecast the time (in years) until the first engine overhaul based on four explanatory variables: (1) annual miles driven (in 1,000s of miles), (2) average load weight (in tons), (3) average driving speed (in mph), and (4) oil change interval (in 1,000s of miles). Based on driver logs and onboard computers, data have been obtained for a sample of 25 trucks. A portion of the data...
The Bendrix Company manufactures various types of parts for automobiles. The manager of the factory wants...
The Bendrix Company manufactures various types of parts for automobiles. The manager of the factory wants to get a better understanding of overhead costs. These overhead costs include supervision, indirect labor, supplies, payroll taxes, overtime premiums, depreciation, and a number of miscellaneous items such as insurance, utilities, and janitorial and maintenance expenses. Some of the overhead costs are “fixed” in the sense they do not vary appreciably with the volume of work being done, whereas others are “variable” and do...
1. One Price Realty Company wants to develop a model to estimate the value of houses in its inventory The office manager has decided to develop a multiple regression model to help explain the va...
 1. One Price Realty Company wants to develop a model to estimate the value of houses in its inventory The office manager has decided to develop a multiple regression model to help explain the variation in house values. (25 points) The office manager has chosen the following variables to develop the model: X1 square feet X2- age in years x3- dummy variable for house style (1 if ranch, 0 if not) X4-2d dummy variable for house style (I if split...
(4 points) The marketing manager at Super Foods wants to develop a regression model to predict...
 (4 points) The marketing manager at Super Foods wants to develop a regression model to predict monthly sales per store of a power bar (in the number of power bars sold in a month) and to determine what variables influence the sales. Two variables are considered here: the price of the power bar, (in cents) and the monthly budget for the in-store promotional expenditures (in dollars). Data are collected from a sample of 20 stores in a supermarket chain and...
Exercise 4.8 Suppose the Sherwin-Williams Company has developed the following multiple regression model, with paint sales...
Exercise 4.8 Suppose the Sherwin-Williams Company has developed the following multiple regression model, with paint sales Y (x 1,000 gallons) as the dependent variable and promotional expenditures A (x $1,000) and selling price P (dollars per gallon) as the independent variables. Y=α+βaA+βpP+εY=α+βaA+βpP+ε Now suppose that the estimate of the model produces following results: α=344.585α=344.585 , ba=0.106ba=0.106 , bp=−12.112bp=−12.112 , sba=0.155sba=0.155 , sbp=4.421sbp=4.421 , R2=0.813R2=0.813 , and F-statistic=10.372F-statistic=10.372 . Note that the sample consists of 10 observations. According to the estimated...
# Part 3) PRICE 'ELASTICITY' (8 points) You are a financial manager for a unit within...
 # Part 3) PRICE 'ELASTICITY' (8 points) You are a financial manager for a unit within a textile company that specializes in zippers, buttons and other fasteners. Your area Vice President gives you the last 16 weeks of sales data for a recently launched product, the Elastiband 2.0 (units sold are in thousands). She asks you to analyze the data and provide a reliable sales forecast for the next four weeks. For your convenience, this data is provided in an...
 The 1-85 Carpet Outlet wants to develop a means to forecast its carpet sales manager believes housing starts in town. The manager has gathered data from coun that the store's sales are directly related to the number of new ty records of monthly ouse construction permits and from store records on monthly sales. These data are as follows: MONTHLY CARPET SALES (¡ooosyd) MONTHLY CONSTRUCİON PERMITS 5 12 30 14 5 10 14 20 16 31 16 a. Develop a linear...
 Jim Royo, manager of Billings Building Supply (BBS), wants to develop a model to forecast BBS's monthly sales (in $1,000's). He selects the dollar value of residential building permits (in $10,000) as the predictor variable. An analysis of the data yielded the following tables. Intercept Coefficients 222.1456 6.152885 Standard Error Statistic p-value 7 4.765 2.971252 0.007284 1 .895423 3.24618 0.003866 df SSMS p-value Regression 1259643.9 A B Residual 38492791.3 Total 39752435,2 Using a = 0.05, the critical value of the...
 The maintenance manager at a trucking company wants to build a regression model to forecast the time (in years) until the first engine overhaul based on four explanatory variables: (1) annual miles driven (in 1,000s of miles), (2) average load weight (in tons), (3) average driving speed (in mph), and (4) oil change interval (in 1,000s of miles). Based on driver logs and onboard computers, data have been obtained for a sample of 25 trucks. A portion of the data...
 1. One Price Realty Company wants to develop a model to estimate the value of houses in its inventory The office manager has decided to develop a multiple regression model to help explain the variation in house values. (25 points) The office manager has chosen the following variables to develop the model: X1 square feet X2- age in years x3- dummy variable for house style (1 if ranch, 0 if not) X4-2d dummy variable for house style (I if split...
 (4 points) The marketing manager at Super Foods wants to develop a regression model to predict monthly sales per store of a power bar (in the number of power bars sold in a month) and to determine what variables influence the sales. Two variables are considered here: the price of the power bar, (in cents) and the monthly budget for the in-store promotional expenditures (in dollars). Data are collected from a sample of 20 stores in a supermarket chain and...
 # Part 3) PRICE 'ELASTICITY' (8 points) You are a financial manager for a unit within a textile company that specializes in zippers, buttons and other fasteners. Your area Vice President gives you the last 16 weeks of sales data for a recently launched product, the Elastiband 2.0 (units sold are in thousands). She asks you to analyze the data and provide a reliable sales forecast for the next four weeks. For your convenience, this data is provided in an...
Most questions answered within 3 hours.
-
3) What are the typical social structures in a global city?
asked 56 minutes ago -
Luther Corporation
Consolidated Balance Sheet
December 31, 2019 and 2018 (in $ millions)
Assets
2019
2018...
asked 58 minutes ago -
(Expected rate of return and risk) Carter Inc. is evaluating a
security. Calculate the investment’s expected...
asked 3 hours ago -
What specific indicators can point to lack of progress for
African Americans in American society?
asked 4 hours ago -
1-The Electrons in a beam are moving at 2.7×10⁸ m/s in an
electric field of 15000...
asked 4 hours ago -
A gas tank is a vertical cylinder. It has a radius of 1m, a
height of...
asked 5 hours ago -
Accent Software faces the following conditions. All of these
support Accent’s use of a market-penetration pricing...
asked 6 hours ago -
A mathematically inclined friend emails you the following
instructions: "Meet me in the cafeteria the first...
asked 6 hours ago -
A monopoly sells in two countries . The demand curves in the two
countries are p1...
asked 7 hours ago -
A .15kg rubber ball is bounced off a wall. Before hitting the
wall, the ball moves...
asked 8 hours ago -
A manufacturing company preparing to build a new plant is
considering three potential locations for it....
asked 8 hours ago -
B. If compound Y has approximately the same values of solubility
in toluene as compound X,...
asked 8 hours ago