
Homework Answers
Answer #1
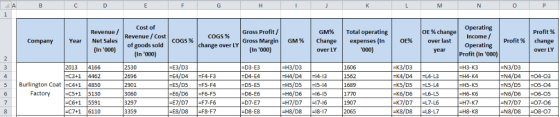
Solution:
| Company | Year | Revenue / Net Sales (In '000) | Cost of Revenue / Cost of goods sold (In '000) | COGS % | COGS % change over LY | Gross Profit / Gross Margin (In '000) | GM % | GM% Change over LY | Total operating expenses (In '000) | OE% | OE % change over last year | Operating Income / Operating Profit (In '000) | Profit % | Profit % change over LY |
| Burlington Coat Factory | 2013 | $4,166.00 | $2,530.00 | 60.73% | $1,636.00 | 39.27% | $1,606.00 | 38.55% | $30.00 | 0.72% | ||||
| 2014 | $4,462.00 | $2,696.00 | 60.42% | -0.31% | $1,766.00 | 39.58% | 0.31% | $1,562.00 | 35.01% | -3.54% | $204.00 | 4.57% | 3.85% | |
| 2015 | $4,850.00 | $2,901.00 | 59.81% | -0.61% | $1,949.00 | 40.19% | 0.61% | $1,689.00 | 34.82% | -0.18% | $260.00 | 5.36% | 0.79% | |
| 2016 | $5,130.00 | $3,060.00 | 59.65% | -0.17% | $2,070.00 | 40.35% | 0.17% | $1,770.00 | 34.50% | -0.32% | $300.00 | 5.85% | 0.49% | |
| 2017 | $5,591.00 | $3,297.00 | 58.97% | -0.68% | $2,294.00 | 41.03% | 0.68% | $1,907.00 | 34.11% | -0.39% | $387.00 | 6.92% | 1.07% | |
| 2018 | $6,110.00 | $3,359.00 | 54.98% | -3.99% | $2,751.00 | 45.02% | 3.99% | $2,065.00 | 33.80% | -0.31% | $686.00 | 11.23% | 4.31% |
0 RevenueRevenue / Cost GM% | Total operating Gross Margin | GM % | Change | expenses (in OE % change! Operating Income/ | Gross Profit Profit % COGS % change over LY | Profit % (in '000) | of goods sold | COGS % | . (In '000) CompanyYear Net Sales OE% over last Operating (In '000) 000) year Profit (In '000) over LY over LY E3/D3 -E4/D4F4-F3 ES/D5 F5-F4 2013 4166 -C3+14462 5 Burlington Coat EC4+1 4850 Factory C5+1 5130 -C6+15591 -C7+1 6110 D3-E3 D4-E4 D5-E5 D6-E6 D7-E7 -D8-E8 2530 1606 «НЗ-K3 -H4-K4 H5-K5 НЕ H3/D3 K3/D3 -N3/D3 4/D4 04-03 N5/D5 05-04 N6/D6 06-05 N7/D707-06 N8/D8 08-07 2696 :H6D6 |-16-15 3060 3297 3359 H6-K6 H7-K7 -H8-K8 E8/D8F8-F7
Know the answer?
Add Answer to:
Complete figures in the empty Cells below Cost of revenue/ Cost of Goods Gross Operating COGS...
Not the answer you're looking for?
Ask your own homework help question.
Our experts will answer your question WITHIN MINUTES for Free.
Similar Homework Help Questions
ADVERTISEMENT
Need Online Homework Help?
Ask
a QuestionGet Answers For Free
Most questions answered within 3 hours.
Most questions answered within 3 hours.
ADVERTISEMENT
ADVERTISEMENT
Active Questions
-
3) What are the typical social structures in a global city?
asked 2 hours ago -
Luther Corporation
Consolidated Balance Sheet
December 31, 2019 and 2018 (in $ millions)
Assets
2019
2018...
asked 2 hours ago -
(Expected rate of return and risk) Carter Inc. is evaluating a
security. Calculate the investment’s expected...
asked 4 hours ago -
What specific indicators can point to lack of progress for
African Americans in American society?
asked 5 hours ago -
1-The Electrons in a beam are moving at 2.7×10⁸ m/s in an
electric field of 15000...
asked 6 hours ago -
A gas tank is a vertical cylinder. It has a radius of 1m, a
height of...
asked 6 hours ago -
Accent Software faces the following conditions. All of these
support Accent’s use of a market-penetration pricing...
asked 7 hours ago -
A mathematically inclined friend emails you the following
instructions: "Meet me in the cafeteria the first...
asked 7 hours ago -
A monopoly sells in two countries . The demand curves in the two
countries are p1...
asked 8 hours ago -
A .15kg rubber ball is bounced off a wall. Before hitting the
wall, the ball moves...
asked 9 hours ago -
A manufacturing company preparing to build a new plant is
considering three potential locations for it....
asked 9 hours ago -
B. If compound Y has approximately the same values of solubility
in toluene as compound X,...
asked 9 hours ago
ADVERTISEMENT