
Homework Answers

 according to distribution of
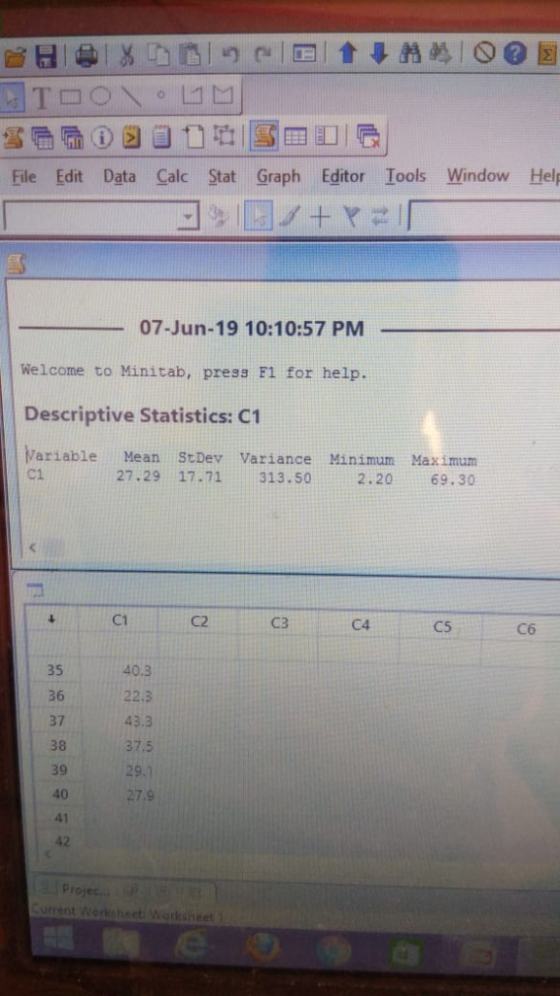
data and data visuals the data shows the normality. There fore we
can say that histogram is good visual graph for this data
presentation.
according to distribution of
data and data visuals the data shows the normality. There fore we
can say that histogram is good visual graph for this data
presentation.
Add Answer to:
1.88 Longleaf pine trees. The Wade Tract in Thomas County, Georgia, is an old- growth forest...
1.87 A stalAlll deviation contest. You must numbers f epmallest possible tions. The nedian the whole...
 1.87 A stalAlll deviation contest. You must numbers f epmallest possible tions. The nedian the whole numbers 10 to 20, with re licking (a) Choose four numbers that have standard deviation. ions.(b) Choose four numbers that have the la ee close standard deviation. what to (c) Is more than one choice possible in eith part (b)? Explain. e right 1.88 Longleaf pine trees. The Wade Tract in behave? County, Georgia, is an old-growth forest of y each trees (Pinus palustris)...
please answer abc show your work figure 6.1 7.31 Tree diameter confidence interval. A study of...
 please answer abc
show your work
figure 6.1
7.31 Tree diameter confidence interval. A study of 584 longleaf pine trees in the Wade Tract in Thomas County, Georgia, is described in Example 6.1 (page 352). For each tree in the tract, the researchers measured the diameter at breast height (DBH). This is the diameter of the tree at a height of 4.5 feet, and the units are centimeters (cm). Only trees with DBH greater than 1.5 cm were sampled. Here...
please answer abc
show your work
figure 6.1
7.31 Tree diameter confidence interval. A study of 584 longleaf pine trees in the Wade Tract in Thomas County, Georgia, is described in Example 6.1 (page 352). For each tree in the tract, the researchers measured the diameter at breast height (DBH). This is the diameter of the tree at a height of 4.5 feet, and the units are centimeters (cm). Only trees with DBH greater than 1.5 cm were sampled. Here...
 1.87 A stalAlll deviation contest. You must numbers f epmallest possible tions. The nedian the whole numbers 10 to 20, with re licking (a) Choose four numbers that have standard deviation. ions.(b) Choose four numbers that have the la ee close standard deviation. what to (c) Is more than one choice possible in eith part (b)? Explain. e right 1.88 Longleaf pine trees. The Wade Tract in behave? County, Georgia, is an old-growth forest of y each trees (Pinus palustris)...
 please answer abc
show your work
figure 6.1
7.31 Tree diameter confidence interval. A study of 584 longleaf pine trees in the Wade Tract in Thomas County, Georgia, is described in Example 6.1 (page 352). For each tree in the tract, the researchers measured the diameter at breast height (DBH). This is the diameter of the tree at a height of 4.5 feet, and the units are centimeters (cm). Only trees with DBH greater than 1.5 cm were sampled. Here...
please answer abc
show your work
figure 6.1
7.31 Tree diameter confidence interval. A study of 584 longleaf pine trees in the Wade Tract in Thomas County, Georgia, is described in Example 6.1 (page 352). For each tree in the tract, the researchers measured the diameter at breast height (DBH). This is the diameter of the tree at a height of 4.5 feet, and the units are centimeters (cm). Only trees with DBH greater than 1.5 cm were sampled. Here...
Most questions answered within 3 hours.
-
. For this set of questions, determine what
proportion of a normal distribution is located betweeneach...
asked 11 minutes ago -
A college student is employed as a door-to-door newspaper
salesman. Historical data suggests that the student...
asked 1 hour ago -
MATLAB HW 11 problem using Switch Case and Input commands
Write a script file that calculates...
asked 50 minutes ago -
Considering gravitational time dilation, calculate the time that
passes in Earth’s surface while 1 hour passes...
asked 1 hour ago -
Minitab Problem: Take the Lake Hume June rainfall data and find
use the processes outlined in...
asked 2 hours ago -
X Company is trying to decide whether to continue using old
equipment to make Product A...
asked 2 hours ago -
IN PYTHON ONLY !! Program 2: Re-work
program #5 (WeeklyHours) from the previous assignment such that...
asked 3 hours ago -
The average length of time between arrivals at a turnpike
toll-booth is 26 seconds. What is...
asked 4 hours ago -
(a) A piston at 6.1 atm contains a gas that occupies a volume of
3.5 L....
asked 5 hours ago -
Please answer true or false. Words
cannot be changed or added in to make it true...
asked 5 hours ago -
An empty test tube weighs 15.923 grams. Then,
MgCl2•6H2O is added into the test tube. After...
asked 5 hours ago -
Assume memory access is 10 units of time and disk access is
10000 units of time....
asked 6 hours ago