Filename: MAE1090_HW9_2.m Write an m-file to evaluate the following complex function ?? = ?? ??+???? for...
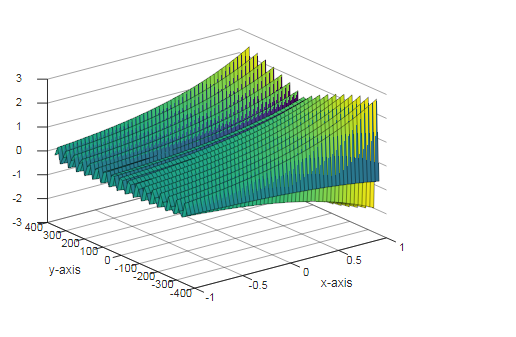
Filename: MAE1090_HW9_2.m Write an m-file to evaluate the following complex function ?? = ?? ??+???? for the interval ?1 ? ?? ? 1 and ?2?? ? ?? ? 2??. Use 50 points in both the ?? and ?? direction. Create a mesh, surface, and contour plot of the function. In each case, plot the real part of ?? versus ?? and ??. Add appropriate axis labels and titles.
Homework Answers
Code:
pi=180;
x = -1:0.0408:1; %0.0408 increment generates 50points between -1 and 1
y = -2*pi : 14.69 :2*pi;
[X,Y]= meshgrid(x,y); %meshgrid generates array of scalar vectors
z = exp(X+i*Y); %compute z
mesh(X,Y,real(z)) %plot mesh plot of real part of z
xlabel('x-axis')
ylabel('y-axis')
title('mesh plot') %gives graph title
surf(X,Y,real(z)) %plot surface plot
xlabel('x-axis')
ylabel('y-axis')
title('surface plot')
contour(X,Y,real(z)) %draw contour plot
xlabel('x-axis')
ylabel('y-axis')
title('contour plot')
output


Add Answer to:
Filename: MAE1090_HW9_2.m Write an m-file to evaluate the
following complex function ?? = ?? ??+???? for...
Create a surface plot, contour plot, and mesh plot of the function z = e^(a+jb) for...
Create a surface plot, contour plot, and mesh plot of the function z = e^(a+jb) for the interval −1 ≤ a ≤ 1 and −2π ≤ b ≤ 2π. Plot the real part of z versus a and b for each of these plots.
Problem 2: Create a surface plot and a contour plot of the function f(x, y) =...
 Problem 2: Create a surface plot and a contour plot of the function f(x, y) = xe-I(x-y2)*+y?] Where -2 x 2 and -2 < y s 2. Use a step size of 0.1. Add labels to the axis
Problem 2: Create a surface plot and a contour plot of the function f(x, y) = xe-I(x-y2)*+y?] Where -2 x 2 and -2
Problem 2: Create a surface plot and a contour plot of the function f(x, y) = xe-I(x-y2)*+y?] Where -2 x 2 and -2 < y s 2. Use a step size of 0.1. Add labels to the axis
Problem 2: Create a surface plot and a contour plot of the function f(x, y) = xe-I(x-y2)*+y?] Where -2 x 2 and -2
matlab only Question 5: a.) Write an m-file using conditional statements to evaluate the following function, assuming that the scalar variable x has a value. The function is for x <-1 - 3e y=2...
 matlab only
Question 5: a.) Write an m-file using conditional statements to evaluate the following function, assuming that the scalar variable x has a value. The function is for x <-1 - 3e y=2+cos(m) for-1 x<5 y 10-5)+1 for r 2 5 Use your file to evaluate y for x5, x-3, and x-15, and Use keyboard entry for values of x. b.) Use a for loop in the above file to plot the above function over the interval -2x <10....
matlab only
Question 5: a.) Write an m-file using conditional statements to evaluate the following function, assuming that the scalar variable x has a value. The function is for x <-1 - 3e y=2+cos(m) for-1 x<5 y 10-5)+1 for r 2 5 Use your file to evaluate y for x5, x-3, and x-15, and Use keyboard entry for values of x. b.) Use a for loop in the above file to plot the above function over the interval -2x <10....
How do I solve using Matlab? Create a matrix X so that the first row has...
 How do I solve using Matlab?
Create a matrix X so that the first row has values from 0 to 50 (default intervals), and the second row has values from 50 to 100. Let matrix Y equal to x10 and Z equal to x + y2 Create 4 subplots containing a mesh, surface, 3-Dimensional, and a surface-contour plot. Label with appropriate titles and labels. The plots should have a string look to them.
How do I solve using Matlab?
Create a matrix X so that the first row has values from 0 to 50 (default intervals), and the second row has values from 50 to 100. Let matrix Y equal to x10 and Z equal to x + y2 Create 4 subplots containing a mesh, surface, 3-Dimensional, and a surface-contour plot. Label with appropriate titles and labels. The plots should have a string look to them.
5. Write a Python function called readlinesmton that accepts the name of the file (i.e. filename),...
 5. Write a Python function called readlinesmton that accepts the name of the file (i.e. filename), starting line number i.e. m) and ending line number (i.e. n) as a parameter. The function then returns the contents from line number m to n (m <n). If m < 1 then start from line 1. Similarly, if n > number of lines the file, then stop at the last line in the file. Sample Input: readlinesmton("data.txt",5,7) Sample Input: readlinesmton("data.txt", 0,10)
python Write the function getSpamLines(filename) that read the filename text file and look for lines of the form &#...
 python
Write the function getSpamLines(filename) that read the filename text file and look for lines of the form 'SPAM-Confidence: float number'. When you encounter a line that starts with "SPAM-Confidence:" extract the floating-point number on the line. The function returns the count of the lines where the confidence value is greater than 0.8. For example, if 'spam.txt' contains the following lines along with normal text getSpamLines('spam.txt') returns 2. SPAM-Confidence: 0.8945 Mary had a little lamb. SPAM-Confidence: 0.8275 SPAM-Confidence: 0.7507 The...
python
Write the function getSpamLines(filename) that read the filename text file and look for lines of the form 'SPAM-Confidence: float number'. When you encounter a line that starts with "SPAM-Confidence:" extract the floating-point number on the line. The function returns the count of the lines where the confidence value is greater than 0.8. For example, if 'spam.txt' contains the following lines along with normal text getSpamLines('spam.txt') returns 2. SPAM-Confidence: 0.8945 Mary had a little lamb. SPAM-Confidence: 0.8275 SPAM-Confidence: 0.7507 The...
MATLAB QUESTION !!! PLEASE USE MATLAB FOR BOTH QUESTIONS!!! THANKS 3) Below is a matrix of...
 MATLAB QUESTION !!! PLEASE USE MATLAB FOR BOTH
QUESTIONS!!! THANKS
3) Below is a matrix of random numbers. Find the mean, median, and mode of the matrix. B=[0 1 2 3 4 50689 23092 6 8 407] Sort Matrix Z so that the largest numbers of each row are in the first column and smallest numbers descend towards the last column. Must use sort function. 4) Create a matrix X so that the first row has values from 0 to...
MATLAB QUESTION !!! PLEASE USE MATLAB FOR BOTH
QUESTIONS!!! THANKS
3) Below is a matrix of random numbers. Find the mean, median, and mode of the matrix. B=[0 1 2 3 4 50689 23092 6 8 407] Sort Matrix Z so that the largest numbers of each row are in the first column and smallest numbers descend towards the last column. Must use sort function. 4) Create a matrix X so that the first row has values from 0 to...
- 1 $(2) - 8.0 a) Create a function file to evaluate f(x). Write the commands...
 - 1 $(2) - 8.0 a) Create a function file to evaluate f(x). Write the commands used to create the function file. b) Obtain 5 numbers decreasing to zero. Write the commands used. c) Evaluate f(x) at the list of numbers approaching zero, write the results, and determine limo-+0+ f(x).
1) Filename: MAE1090_HW7_1.m Write an m-file that determines the maximum value in a vector, x, and...
1) Filename: MAE1090_HW7_1.m Write an m-file that determines the maximum value in a vector, x, and stores that maximum value as the variable y. Your m-file should work for both row and column vectors. For the purpose of testing and grading your m-file: DO NOT issue a clear command at the start of your m-file DO NOT define the vector x within your m-file. That vector should exist in the workspace prior to executing your m-file. Do...
"PYTHON" 1. a. Create a file (module) named camera_picture.py. b. Write a function, take_picture_effect, that takes...
"PYTHON" 1. a. Create a file (module) named camera_picture.py. b. Write a function, take_picture_effect, that takes two parameters, the filename and an effect. c. Take a picture with the filename and effect. Use camera.effect to set the effect. Use help(PiCamera) to find the effects which you can apply. d. Create a second file use_camera.py. e. Import the take_picture_effect function from the camera_picture module. f. Prompt the user for the filename. g. Prompt the user for the image_effect. help(PiCamera) to see...
 Problem 2: Create a surface plot and a contour plot of the function f(x, y) = xe-I(x-y2)*+y?] Where -2 x 2 and -2 < y s 2. Use a step size of 0.1. Add labels to the axis
Problem 2: Create a surface plot and a contour plot of the function f(x, y) = xe-I(x-y2)*+y?] Where -2 x 2 and -2
Problem 2: Create a surface plot and a contour plot of the function f(x, y) = xe-I(x-y2)*+y?] Where -2 x 2 and -2 < y s 2. Use a step size of 0.1. Add labels to the axis
Problem 2: Create a surface plot and a contour plot of the function f(x, y) = xe-I(x-y2)*+y?] Where -2 x 2 and -2
 matlab only
Question 5: a.) Write an m-file using conditional statements to evaluate the following function, assuming that the scalar variable x has a value. The function is for x <-1 - 3e y=2+cos(m) for-1 x<5 y 10-5)+1 for r 2 5 Use your file to evaluate y for x5, x-3, and x-15, and Use keyboard entry for values of x. b.) Use a for loop in the above file to plot the above function over the interval -2x <10....
matlab only
Question 5: a.) Write an m-file using conditional statements to evaluate the following function, assuming that the scalar variable x has a value. The function is for x <-1 - 3e y=2+cos(m) for-1 x<5 y 10-5)+1 for r 2 5 Use your file to evaluate y for x5, x-3, and x-15, and Use keyboard entry for values of x. b.) Use a for loop in the above file to plot the above function over the interval -2x <10....
 How do I solve using Matlab?
Create a matrix X so that the first row has values from 0 to 50 (default intervals), and the second row has values from 50 to 100. Let matrix Y equal to x10 and Z equal to x + y2 Create 4 subplots containing a mesh, surface, 3-Dimensional, and a surface-contour plot. Label with appropriate titles and labels. The plots should have a string look to them.
How do I solve using Matlab?
Create a matrix X so that the first row has values from 0 to 50 (default intervals), and the second row has values from 50 to 100. Let matrix Y equal to x10 and Z equal to x + y2 Create 4 subplots containing a mesh, surface, 3-Dimensional, and a surface-contour plot. Label with appropriate titles and labels. The plots should have a string look to them.
 5. Write a Python function called readlinesmton that accepts the name of the file (i.e. filename), starting line number i.e. m) and ending line number (i.e. n) as a parameter. The function then returns the contents from line number m to n (m <n). If m < 1 then start from line 1. Similarly, if n > number of lines the file, then stop at the last line in the file. Sample Input: readlinesmton("data.txt",5,7) Sample Input: readlinesmton("data.txt", 0,10)
 python
Write the function getSpamLines(filename) that read the filename text file and look for lines of the form 'SPAM-Confidence: float number'. When you encounter a line that starts with "SPAM-Confidence:" extract the floating-point number on the line. The function returns the count of the lines where the confidence value is greater than 0.8. For example, if 'spam.txt' contains the following lines along with normal text getSpamLines('spam.txt') returns 2. SPAM-Confidence: 0.8945 Mary had a little lamb. SPAM-Confidence: 0.8275 SPAM-Confidence: 0.7507 The...
python
Write the function getSpamLines(filename) that read the filename text file and look for lines of the form 'SPAM-Confidence: float number'. When you encounter a line that starts with "SPAM-Confidence:" extract the floating-point number on the line. The function returns the count of the lines where the confidence value is greater than 0.8. For example, if 'spam.txt' contains the following lines along with normal text getSpamLines('spam.txt') returns 2. SPAM-Confidence: 0.8945 Mary had a little lamb. SPAM-Confidence: 0.8275 SPAM-Confidence: 0.7507 The...
 MATLAB QUESTION !!! PLEASE USE MATLAB FOR BOTH
QUESTIONS!!! THANKS
3) Below is a matrix of random numbers. Find the mean, median, and mode of the matrix. B=[0 1 2 3 4 50689 23092 6 8 407] Sort Matrix Z so that the largest numbers of each row are in the first column and smallest numbers descend towards the last column. Must use sort function. 4) Create a matrix X so that the first row has values from 0 to...
MATLAB QUESTION !!! PLEASE USE MATLAB FOR BOTH
QUESTIONS!!! THANKS
3) Below is a matrix of random numbers. Find the mean, median, and mode of the matrix. B=[0 1 2 3 4 50689 23092 6 8 407] Sort Matrix Z so that the largest numbers of each row are in the first column and smallest numbers descend towards the last column. Must use sort function. 4) Create a matrix X so that the first row has values from 0 to...
 - 1 $(2) - 8.0 a) Create a function file to evaluate f(x). Write the commands used to create the function file. b) Obtain 5 numbers decreasing to zero. Write the commands used. c) Evaluate f(x) at the list of numbers approaching zero, write the results, and determine limo-+0+ f(x).
Most questions answered within 3 hours.
-
The average length of time between arrivals at a turnpike
toll-booth is 26 seconds. What is...
asked 1 hour ago -
(a) A piston at 6.1 atm contains a gas that occupies a volume of
3.5 L....
asked 2 hours ago -
Please answer true or false. Words
cannot be changed or added in to make it true...
asked 2 hours ago -
An empty test tube weighs 15.923 grams. Then,
MgCl2•6H2O is added into the test tube. After...
asked 2 hours ago -
Assume memory access is 10 units of time and disk access is
10000 units of time....
asked 2 hours ago -
1. Are all good samples random?
2. Magazines often report surveys giving statistics such as “63%...
asked 2 hours ago -
Under all the various types of market structures, firms
must eventually earn some economic profits for...
asked 2 hours ago -
Consider the following fitness regime for a single locus trait
with two co-dominant alleles: w11 =...
asked 2 hours ago -
A large cable company reports the following.
80% of its customers subscribe to its cable TV...
asked 3 hours ago -
Please answer the question in brief.
Discuss the role of ERP in organizations. Are ERP tools...
asked 2 hours ago -
Discuss the pros and cons of collaborative software such
as SameTime. Does it increase productivity? What...
asked 3 hours ago -
Buying your in-laws a gift because it’s expected is
due to the ____________ motive of gift-giving....
asked 3 hours ago