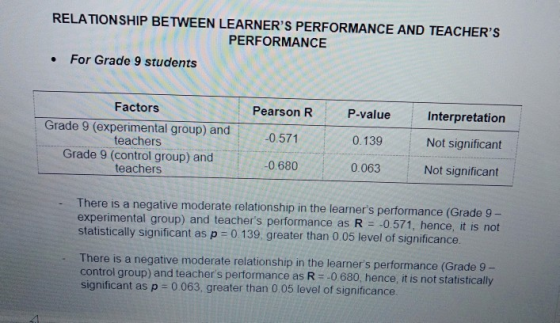
What do you mean by negative moderate relationship between the learner's performance and teacher's performance in layman's term?
Homework Answers
Negative relationship implies as one variable increases, the other one tends to decrease or the other way round.
Moderate relationship implies as one variable increases, the other will also increase but the rate of increase is moderate. Similarly if one variable decreases, the other one will also decrease but in a moderate rate.
Correlation co-efficient lies between -1 and +1. Higher absolute value implies stronger relationship. Here, the correlation between learner's performance and teacher's performance is -0.571, so it is in moderate range.
Add Answer to:
What do you mean by negative moderate relationship
between the learner's performance and teacher's performance in...
What is the relationship between the attendance at a major league ball game and the total...
 What is the relationship between the attendance at a major league ball game and the total number of runs scored? Attendance figures in thousands) and the runs scored for 9 randomly selected games are shown below. Attendance 60 36 13 18 40 21 51 45 47 11 7 8 Runs 12 7 2 7 10 الا a. Find the correlation coefficient: r = Round to 2 decimal places. b. The null and alternative hypotheses for correlation are: HO: ?v =...
What is the relationship between the amount of time statistics students study per week and their...
What is the relationship between the amount of time statistics students study per week and their final exam scores? The results of the survey are shown below. Time 12 0 3 14 14 9 0 13 10 Score 95 60 73 85 86 89 65 97 93 Find the correlation coefficient: r=r= Round to 2 decimal places. The null and alternative hypotheses for correlation are: H0:H0: ? μ ρ r == 0 H1:H1: ? ρ μ r ≠≠ 0 The p-value is: (Round...
3. Many studies have found a negative relationship between exercise and depression. Suppose we wish to...
 3. Many studies have found a negative relationship between exercise and depression. Suppose we wish to evaluate this claim experimentally. We randomly assign a group of participants suffering from depression into two groups: those who participate in an exercise program 4 days a week for 2 months, and a control group not assigned to an exercise regimen. Depression is measured at the end of two months. The data are below: Exercise No Exercise 19 25 25 17 27 35 15...
What is the relationship between the attendance at a major league ball game and the total...
 What is the relationship between the attendance at a major league ball game and the total number of ruins sored Attendance figures in thousands and the runs scored for randomly selected games are shown Attendance 15 20 21 5212 23 10 32 13 Runs 8 7 0 13 3 2310 9 .. Find the correlation coefficient: - Round to 2 decimal places. b. The null and alternative hypotheses for correlation are: ROO The p-value is Pound to four decimal places...
What is the relationship between the number of minutes per day a woman spends talking on...
 What is the relationship between the number of minutes per day a woman spends talking on the phone and the woman's weight? The time on the phone and weight for 9 women are shown in the table below. 28 15 Time Pounds 68 149 22 100 64 124 57 143 67 141 101 77 126 68 127 100 0 a. Find the correlation coefficient: r = Round to 2 decimal places. b. The null and alternative hypotheses for correlation are:...
What is the relationship between the amount of time statistics students study per week and their...
 What is the relationship between the amount of time statistics students study per week and their final exam scores? The results of the survey are shown below. Time Score 3 10 15 512 015 58 75 89 89 77 79 54 96 a. Find the correlation coefficient: r = Round to 2 decimal places. b. The null and alternative hypotheses for correlation are: Ho: ? - 0 H: 70 (Round to four The p-value is: decimal places) c. Use a...
A study was done to look at the relationship between number of movies people watch at...
A study was done to look at the relationship between number of movies people watch at the theater each year and the number of books that they read each year. The results of the survey are shown below. Movies 6 4 7 10 2 3 6 7 9 10 3 2 Books 6 8 6 4 14 9 11 5 9 8 12 9 Find the correlation coefficient: r=r= Round to 2 decimal places. The null and alternative hypotheses for correlation...
An agency examined the relationship between the ozone level (in parts per million or ppm) and the population (in D...
 An agency examined the relationship between the ozone level (in parts per million or ppm) and the population (in Dependent variable is: Ozone millions) of cities. Part of the regression analysis is shown to the right. Complete parts a and b below. R squared-84.3% s 5.418 with 16-2 14 df Coeff 18.162 6.501 SE(Coeff) 2.098 2.093 Variable Intercept Population a) It is-suspected that the greater the population of a city, the higher its ozone level. Is the relationship statistically significant?...
An agency examined the relationship between the ozone level (in parts per million or ppm) and...
An agency examined the relationship between the ozone level (in parts per million or ppm) and the population (in millions) of cities. Part of the regression analysis is shown to the right. Complete parts a and b below. Dependent variable is: Ozone R squaredequals82.2% s=5.158 with 16-2=14 df Variable Coeff SE (Coeff) Intercept 18.769 2.311 Population 6.701 2.027 a) It is suspected that the greater the population of a city, the higher its ozone level. Is the relationship statistically...
please correct red error boxes What is the relationship between the amount of time statistics students...
 please correct red error boxes
What is the relationship between the amount of time statistics students study per week and their final exam scores! The results of the survey are shown below The ruil and alternative hypotheses for correlation are The preluet: 1.0024 Round to four decimal places c. Use a level of sigrice -0.05 to state the conclusion of the hypothesis test in the context of There la statistically significant evidence la conclude that there a carrodation between the...
please correct red error boxes
What is the relationship between the amount of time statistics students study per week and their final exam scores! The results of the survey are shown below The ruil and alternative hypotheses for correlation are The preluet: 1.0024 Round to four decimal places c. Use a level of sigrice -0.05 to state the conclusion of the hypothesis test in the context of There la statistically significant evidence la conclude that there a carrodation between the...
 What is the relationship between the attendance at a major league ball game and the total number of runs scored? Attendance figures in thousands) and the runs scored for 9 randomly selected games are shown below. Attendance 60 36 13 18 40 21 51 45 47 11 7 8 Runs 12 7 2 7 10 الا a. Find the correlation coefficient: r = Round to 2 decimal places. b. The null and alternative hypotheses for correlation are: HO: ?v =...
 3. Many studies have found a negative relationship between exercise and depression. Suppose we wish to evaluate this claim experimentally. We randomly assign a group of participants suffering from depression into two groups: those who participate in an exercise program 4 days a week for 2 months, and a control group not assigned to an exercise regimen. Depression is measured at the end of two months. The data are below: Exercise No Exercise 19 25 25 17 27 35 15...
 What is the relationship between the attendance at a major league ball game and the total number of ruins sored Attendance figures in thousands and the runs scored for randomly selected games are shown Attendance 15 20 21 5212 23 10 32 13 Runs 8 7 0 13 3 2310 9 .. Find the correlation coefficient: - Round to 2 decimal places. b. The null and alternative hypotheses for correlation are: ROO The p-value is Pound to four decimal places...
 What is the relationship between the number of minutes per day a woman spends talking on the phone and the woman's weight? The time on the phone and weight for 9 women are shown in the table below. 28 15 Time Pounds 68 149 22 100 64 124 57 143 67 141 101 77 126 68 127 100 0 a. Find the correlation coefficient: r = Round to 2 decimal places. b. The null and alternative hypotheses for correlation are:...
 What is the relationship between the amount of time statistics students study per week and their final exam scores? The results of the survey are shown below. Time Score 3 10 15 512 015 58 75 89 89 77 79 54 96 a. Find the correlation coefficient: r = Round to 2 decimal places. b. The null and alternative hypotheses for correlation are: Ho: ? - 0 H: 70 (Round to four The p-value is: decimal places) c. Use a...
 An agency examined the relationship between the ozone level (in parts per million or ppm) and the population (in Dependent variable is: Ozone millions) of cities. Part of the regression analysis is shown to the right. Complete parts a and b below. R squared-84.3% s 5.418 with 16-2 14 df Coeff 18.162 6.501 SE(Coeff) 2.098 2.093 Variable Intercept Population a) It is-suspected that the greater the population of a city, the higher its ozone level. Is the relationship statistically significant?...
 please correct red error boxes
What is the relationship between the amount of time statistics students study per week and their final exam scores! The results of the survey are shown below The ruil and alternative hypotheses for correlation are The preluet: 1.0024 Round to four decimal places c. Use a level of sigrice -0.05 to state the conclusion of the hypothesis test in the context of There la statistically significant evidence la conclude that there a carrodation between the...
please correct red error boxes
What is the relationship between the amount of time statistics students study per week and their final exam scores! The results of the survey are shown below The ruil and alternative hypotheses for correlation are The preluet: 1.0024 Round to four decimal places c. Use a level of sigrice -0.05 to state the conclusion of the hypothesis test in the context of There la statistically significant evidence la conclude that there a carrodation between the...
Most questions answered within 3 hours.
-
Consider a 1.0 L buffer containing 0.092 mol L-1 HCOOH and 0.100
mol L-1 HCOO-. What...
asked 1 minute ago -
Koch Realty has owned a vacant land with a FMV of
$775,000 and an adjusted basis...
asked 6 minutes ago -
It is estimated 29% of all adults in United States invest in
stocks and that 85%...
asked 6 minutes ago -
What does a 2-sided p value of 0.04 mean? (I am not asking if it
is...
asked 20 minutes ago -
A parallel-plate capacitor is made from two aluminum-foil
sheets, each 7.8 cmcm wide and 5.1 mmlong....
asked 22 minutes ago -
1. why is toluene a stronger nucleophile than benzene?
2.why is phenol a stronger nucleophile than...
asked 38 minutes ago -
4. How can you solve for the density of the liquid from the
slope? Please show...
asked 38 minutes ago -
when 2053 j of heat is added to 46.3 g of hexane C6H14 the
temperature increases...
asked 1 hour ago -
I need new and unique answers, please. (Use your own words,
don't copy and paste), Please...
asked 1 hour ago -
MCL 445.111 et seq. deals with Home Solicitation Sales.
MCL stands for Michigan Compiled Laws which...
asked 56 minutes ago -
Which of the following items may not create an NOL?
a.
sole proprietorship loss
b.
personal...
asked 1 hour ago -
A hypothetical solution forms between a solid and a liquid. The
values of the thermodynamic quantities...
asked 59 minutes ago