I need help answering the questions below. Please help :) Graph the frequency distribution as a...
I need help answering the questions below. Please help :)
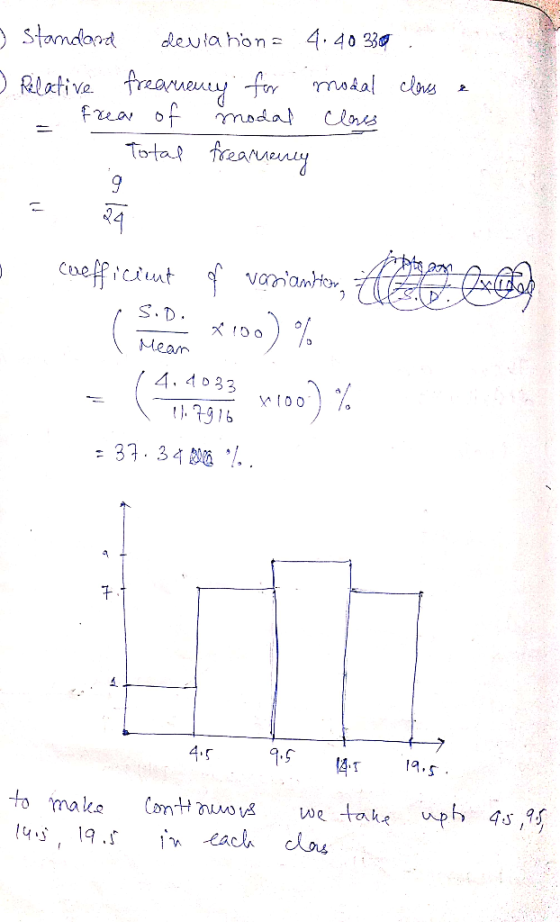
Graph the frequency distribution as a histogram graph.
Carry all calculations and the answer to 4 decimal places unless otherwise noted. For example, the number "123.0000" has been carried and reported to 4 decimal places. (Yes, trailing zeros count.)
The Countrytown School District has recorded the number of absences in a school year for a random sample of 24 students. The school board is concerned that half of their students may be missing two weeks or more of school attendance.
Number of absences from a random sample of 24 students
2 5 5 7 8 8
9 9 11 11 11
13 13 14 14 14 14
15 15 15 16 17 18 19
- How many classes will the Frequency Distribution Table have for this data set?
- What is the Class Width for each class?
- When drawing the frequency polygon, what is the lower x-intercept?
- When drawing the frequency polygon, what is the upper x-intercept?
- What is the mean (arithmetic average) for this data set? (round your answer to 4 decimal places).
- What is the median for this data set? (report your answer to 4 decimal places)
- What is the midpoint of the modal class for this data set? (report your answer to 4 decimal places).
- What is the relative frequency of the modal class for this data set? (report your answer to 4 decimal places)
- What is the standard deviation for this data set? (round your answer to 4 decimal places)
- What is the Coefficient Of Variation for this data set? (Note: COV is a % reported to 2 decimal places, like "12.34%" so remember to use the % sign after the numerical answer.)
- Viewing the graph of the histogram, how would you correctly describe this distribution?
- Which measure of central tendency should be used to interpret this data set?
- Refer to your answer in Question # 12. Why is the correct choice for the measure of central tendency in Question # 12 the preferred choice?
- Regarding the practical application of these statistical results, do you think that the school board should be worried about excessive absences according to their concerns?
- To study whether the number of absences is increasing, decreasing, or remaining about the same when comparing consecutive school years, what type of study should the Superintendent of Schools design?
Homework Answers


Add Answer to:
I need help answering the questions below. Please help :)
Graph the frequency distribution as a...
I really need help answering these questions! Please help Graph the frequency distribution as a histogram...
I really need help answering these questions! Please help Graph the frequency distribution as a histogram graph. Use StatDisk to draw the graph. Describe the histogram and choose one of the measures of central tendency to interpret this data set. Carry all calculations and the answer to 4 decimal places unless otherwise noted. For example, the number "123.0000" has been carried and reported to 4 decimal places. (Yes, trailing zeros count.) The county library staff has recorded the number of...
➢ Show the answers in the Frequency Distribution Table to 4 decimals. As the owner of...
➢ Show the answers in the Frequency Distribution Table to 4 decimals. As the owner of this pizza parlour, you want to develop advertise-ments for television. You select a random sample of 16 young customers and obtain the following data on their ages: Ages in years from a random sample of 16 young customers at Charles Y. Cheese Pizza Emporium 4 5 7 8 9 10 11 11 11 11 11 12 13 13 14 18 o Complete the Quartile...
please help 2. The incomplete frequency distribution table given below represents the score of an exam...
 please help
2. The incomplete frequency distribution table given below represents the score of an exam in a math class. (a) (5 points) Complete the frequency distribution table below: Class Class Class Class Cumulative Percentage Limits Boundaries Midpoint Frequency Frequency Frequency 154.5, 55 - 67 61 4 167,5 4 110.00% 675, 68 - 80 9 180.5 174 13 122.50% 81-93 180.5, 16 13.5 29 193.5 94 -106 100 11 1106.5 40 (b) (2 points) Find the class width for this...
please help
2. The incomplete frequency distribution table given below represents the score of an exam in a math class. (a) (5 points) Complete the frequency distribution table below: Class Class Class Class Cumulative Percentage Limits Boundaries Midpoint Frequency Frequency Frequency 154.5, 55 - 67 61 4 167,5 4 110.00% 675, 68 - 80 9 180.5 174 13 122.50% 81-93 180.5, 16 13.5 29 193.5 94 -106 100 11 1106.5 40 (b) (2 points) Find the class width for this...
Refer to the PowerPoint notes to help you complete the worksheet. Use StatDisk to draw the...
Refer to the PowerPoint notes to help you complete the worksheet. Use StatDisk to draw the histogram graph. Show the answers in the Frequency Distribution Table to 4 decimals. As the owner of this pizza parlour, you want to develop advertise-ments for television. You select a random sample of 16 young customers and obtain the following data on their ages:Ages in years from a random sample of 16 young customers at Charles Y. Cheese Pizza Emporium 4 5 7 8 9 10 11 11 11 11 11 ...
Construct a frequency distribution and a frequency histogram for the Construct a frequency distribution of the...
 Construct a frequency distribution and a frequency histogram for the Construct a frequency distribution of the data. Use the minimum data data set using the indicated number of classes. Describe any patterns.entry as the lower limit of the first class. Number of classes: 8 Data set: Finishing times (in seconds) of 20 Class Frequency male participants in a 5K race 리다□ □ 1719 1632 1573 1474 2300 1445 1250 1801 1597 1775 1955 1520 1824 1620 1304 1819 2020 2084...
Construct a frequency distribution and a frequency histogram for the data set using the indicated number...
Construct a frequency distribution and a frequency histogram for the data set using the indicated number of classes. Describe any patterns. Number of classes: 8 Data set: Finishing times (in seconds) of 20 male participants in a 5K race Construct a frequency distribution of the data. Use the minimum data entry as the lower limit of the first class. Construct a frequency histogram of the data. Describe any patterns. Choose the correct answer below. A. the classes with the greatest...
Do students need Summer Development? For 108 randomly selected college applicants, the following frequency distribution for...
Do students need Summer Development? For 108 randomly selected college applicants, the following frequency distribution for entrance exam scores was obtained. Construct a histogram, frequency polygon, and ogive for the data. (The data for this exercise will be used for Exercise 13 in this section.) Class limits Frequency 90–98 6 99–107 22 108–116 43 117–125 28 126–134 9 Applicants who score above 107 need not enroll in a summer developmental program. In this group, how many students do not have...
Please answer all questions! thanks :) VI/ Test scores from a math midterm are as follows:...
 Please
answer all questions! thanks :)
VI/ Test scores from a math midterm are as follows: 79, 90, 85, 89, 70, 59, 75, 64, 83, 78, 75, 77, 78, 77, 67, 85, 74, 52, 87, 72, 69, 76, 61, 77, 93, 86, 79, 90, 74, 67, 51, 75, 77, 82, 78, 60, 86, 72, 91, 95, 82 Complete the frequency distribution table to include all data a. Class Tallies Class Midpoint Relative Cumulative Frequency relative freq boundaries Frequency 51 57...
Please
answer all questions! thanks :)
VI/ Test scores from a math midterm are as follows: 79, 90, 85, 89, 70, 59, 75, 64, 83, 78, 75, 77, 78, 77, 67, 85, 74, 52, 87, 72, 69, 76, 61, 77, 93, 86, 79, 90, 74, 67, 51, 75, 77, 82, 78, 60, 86, 72, 91, 95, 82 Complete the frequency distribution table to include all data a. Class Tallies Class Midpoint Relative Cumulative Frequency relative freq boundaries Frequency 51 57...
please help with letters G & H and number 3 letters A-C 2. The incomplete frequency...
 please help with letters G & H and number 3 letters
A-C
2. The incomplete frequency distribution table given below represents the score of an exam in a math class. (a) (5 points) Complete the frequency distribution table below Class Class Class Cumulative Percentage Limits Boundaries Midpoint Frequency Frequency Frequency 154.5, 55 — 67 61 4 167.5 4 Class 110,000 122.50% 9 13 40.00% 68 - 80 180.5 174 81 - 93 180.s, 187 16 29 23.5 93.5 94-106 40...
please help with letters G & H and number 3 letters
A-C
2. The incomplete frequency distribution table given below represents the score of an exam in a math class. (a) (5 points) Complete the frequency distribution table below Class Class Class Cumulative Percentage Limits Boundaries Midpoint Frequency Frequency Frequency 154.5, 55 — 67 61 4 167.5 4 Class 110,000 122.50% 9 13 40.00% 68 - 80 180.5 174 81 - 93 180.s, 187 16 29 23.5 93.5 94-106 40...
 please help
2. The incomplete frequency distribution table given below represents the score of an exam in a math class. (a) (5 points) Complete the frequency distribution table below: Class Class Class Class Cumulative Percentage Limits Boundaries Midpoint Frequency Frequency Frequency 154.5, 55 - 67 61 4 167,5 4 110.00% 675, 68 - 80 9 180.5 174 13 122.50% 81-93 180.5, 16 13.5 29 193.5 94 -106 100 11 1106.5 40 (b) (2 points) Find the class width for this...
please help
2. The incomplete frequency distribution table given below represents the score of an exam in a math class. (a) (5 points) Complete the frequency distribution table below: Class Class Class Class Cumulative Percentage Limits Boundaries Midpoint Frequency Frequency Frequency 154.5, 55 - 67 61 4 167,5 4 110.00% 675, 68 - 80 9 180.5 174 13 122.50% 81-93 180.5, 16 13.5 29 193.5 94 -106 100 11 1106.5 40 (b) (2 points) Find the class width for this...
 Construct a frequency distribution and a frequency histogram for the Construct a frequency distribution of the data. Use the minimum data data set using the indicated number of classes. Describe any patterns.entry as the lower limit of the first class. Number of classes: 8 Data set: Finishing times (in seconds) of 20 Class Frequency male participants in a 5K race 리다□ □ 1719 1632 1573 1474 2300 1445 1250 1801 1597 1775 1955 1520 1824 1620 1304 1819 2020 2084...
 Please
answer all questions! thanks :)
VI/ Test scores from a math midterm are as follows: 79, 90, 85, 89, 70, 59, 75, 64, 83, 78, 75, 77, 78, 77, 67, 85, 74, 52, 87, 72, 69, 76, 61, 77, 93, 86, 79, 90, 74, 67, 51, 75, 77, 82, 78, 60, 86, 72, 91, 95, 82 Complete the frequency distribution table to include all data a. Class Tallies Class Midpoint Relative Cumulative Frequency relative freq boundaries Frequency 51 57...
Please
answer all questions! thanks :)
VI/ Test scores from a math midterm are as follows: 79, 90, 85, 89, 70, 59, 75, 64, 83, 78, 75, 77, 78, 77, 67, 85, 74, 52, 87, 72, 69, 76, 61, 77, 93, 86, 79, 90, 74, 67, 51, 75, 77, 82, 78, 60, 86, 72, 91, 95, 82 Complete the frequency distribution table to include all data a. Class Tallies Class Midpoint Relative Cumulative Frequency relative freq boundaries Frequency 51 57...
 please help with letters G & H and number 3 letters
A-C
2. The incomplete frequency distribution table given below represents the score of an exam in a math class. (a) (5 points) Complete the frequency distribution table below Class Class Class Cumulative Percentage Limits Boundaries Midpoint Frequency Frequency Frequency 154.5, 55 — 67 61 4 167.5 4 Class 110,000 122.50% 9 13 40.00% 68 - 80 180.5 174 81 - 93 180.s, 187 16 29 23.5 93.5 94-106 40...
please help with letters G & H and number 3 letters
A-C
2. The incomplete frequency distribution table given below represents the score of an exam in a math class. (a) (5 points) Complete the frequency distribution table below Class Class Class Cumulative Percentage Limits Boundaries Midpoint Frequency Frequency Frequency 154.5, 55 — 67 61 4 167.5 4 Class 110,000 122.50% 9 13 40.00% 68 - 80 180.5 174 81 - 93 180.s, 187 16 29 23.5 93.5 94-106 40...
Most questions answered within 3 hours.
-
The factory method and the abstract factory pattern use
different object oriented
mechanisms are used to...
asked 3 hours ago -
Given the data below for the monthly sales data at each branch in
your region for...
asked 4 hours ago -
Blossom Company owns 10000 of the 50000 outstanding shares of
Taylor, Inc. common stock. During 2018,...
asked 5 hours ago -
Calculate the following: ***SHOW ALL WORK!!!! Or
NO CREDIT*** Circle your answers. 8pts
each
In the...
asked 7 hours ago -
Bank Z is currently advertising interest rates on its checking
account. They claim to pay an...
asked 7 hours ago -
List two ways of transformation on the response variable that
can be used to deal with...
asked 8 hours ago -
If a 2000 ohm resistor has a -3.90 mA current going through it.
What is the...
asked 8 hours ago -
Please comment on the sentences.
Some types of jobs require more training than others. Some
companies...
asked 9 hours ago -
The )G01 for the hydrolysis of phosphorarginine
reaction depicted below is –32 kJ mol-1.
Phosphoarginine ...
asked 9 hours ago -
Cross a heterozygous blue-eyed goat with a homozygous brown-eyed
goat. Be sure to indicate which kids...
asked 10 hours ago -
Use the following information to answer the next two
questions.
Please refer to question 9-90. A...
asked 10 hours ago -
A solution containing 0.050 g of an unknown electrolyte in 2.50
g of cyclohexane was found...
asked 10 hours ago