Section P.5: Density Curves and the Normal Distribution Example 1: Find the specified areas for a...
Section P.5: Density Curves and the Normal Distribution
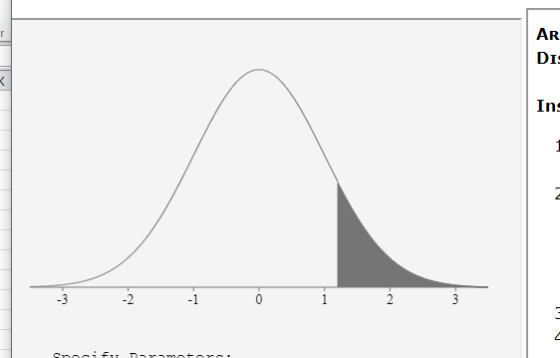
Example 1: Find the specified areas for a standard normal density, and sketch the area. (a) The area below z = 0.8 (b) The area above z = 1.2 (c) The area between z = -1 and z = 2
Example 2: Find endpoints on a standard normal density with the given property, and sketch the area.
(a) The area to the left of the endpoint is about 0.20.
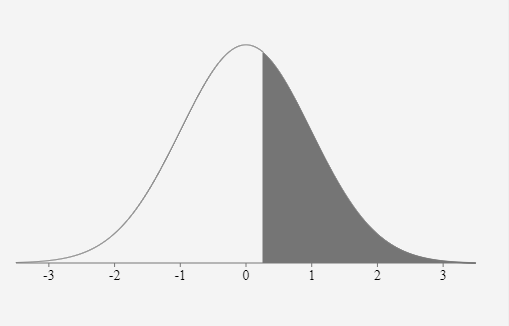
(b) The area to the right of the endpoint is 0.4.
(c) The area between ± z is 0.80.
Quick Self-Quiz: Standard Normal Distribution Find the specified areas for a standard normal density, and sketch the area.
(a) The area above 2.58
(b) The area below –1.32
(c) The area between 0.85 and 1.35
Find endpoints on a standard normal density with the given property, and sketch the area.
(a) The area to the right of the endpoint is 0.70
(b) The area to the left of the endpoint is 0.10
(c) The area between ±Z is 0.90 ?
Example 3:
Find the specified areas for a normal density. (a) The area above 62 in a N(50,10) density. (b) The area between 5 and 8 in a N(10,2) density.
Example 4:
Find endpoints on the given normal density curve with the given property.
(a) The area to the right on a N(10,4) density curve is about 0.05.
(b) The area to the left on a N(100,25) density curve is about 0.35.
Quick Self-Quiz:
Weights of Newborns Suppose weights of newborn babies in one community are normally distributed with a mean of 7.5 pounds and a standard deviation of 1.2 pounds.
(a) Use the 95% rule to sketch a graph of this normal density curve. Include a scale with at least three values on the horizontal axis.
(b) What percent of newborns weigh less than 5 pounds?
(c) What percent of newborns weight more than 11 pounds?
(d) If a newborn baby is at the 15th percentile for weight, what is the baby's weight?
Homework Answers
Example1:
(a) The area below z = 0.8

(b) The area above z = 1.2
(c) The area between z = -1 and z = 2

Example 2:
(a) The area to the left of the endpoint is about 0.20.
Z=-.8416

(b) The area to the right of the endpoint is 0.4.
Z=0.2533
(c) The area between ± z is 0.80.
between -1.282 and 1.282 or between +/- 1.282
Add Answer to:
Section P.5: Density Curves and the Normal Distribution
Example 1: Find the specified areas for a...
Question 4 2 pts Use StatKey to find the endpoint with the given property: . The...
 Question 4 2 pts Use StatKey to find the endpoint with the given property: . The area to the right of the endpoint on a N(500,26) curve is about 0.05. Endpoint 457.234 473.846 523.223 542.766 4 pts Question 5 Use StatKey to identify the answer closest to the specified areas for a N(0, 1) density. The area to the left of z = 1.52. Area = [Select] The area between z = 0.31 and z = 1.79. Area = [Select)...
1. Sketch the area under the standard normal curve over the indicated interval and find the...
1. Sketch the area under the standard normal curve over the indicated interval and find the specified area. (Round your answer to four decimal places.) The area to the left of z = 0 is _______ 2. Sketch the area under the standard normal curve over the indicated interval and find the specified area. (Round your answer to four decimal places.) The area to the left of z = −0.49 is _______ 3. Sketch the area under the standard normal...
Sketch the area under the standard normal curve over the indicated interval and find the specified...
Sketch the area under the standard normal curve over the indicated interval and find the specified area. (Round your answer to four decimal places.) The area to the left of z = 0.40 is . The area to the right of z = −1.18 is The area between z = −2.19 and z = 1.25 is
Sketch the area under the standard normal curve over the indicated interval and find the specified...
Sketch the area under the standard normal curve over the indicated interval and find the specified area. (Round your answer to four decimal places.) The area to the left of z = −1.40 is . The area to the left of z = 0.42 is . The area to the right of z = 1.58 is . The area to the right of z = −1.16 is . The area between z = 0 and z = −1.85 is ....
Use a table of areas to find the specified area under the standard normal curve. 12)...
Use a table of areas to find the specified area under the standard normal curve. 12) The area that lies between 0 and 3.01 A) 0.4987 B) 0.9987 C) 0.5013 How is A the answer and not B?
Sketch the area under the standard normal curve over the indicated interval and find the specified...
Sketch the area under the standard normal curve over the indicated interval and find the specified area. (Round your answer to four decimal places.) The area to the left of z = 0.62 is The area to the right of z = 0.08 is
Sketch the area under the standard normal curve over the indicated interval and find the specified...
Sketch the area under the standard normal curve over the indicated interval and find the specified area. (Round your answer to four decimal places.) The area to the left of z = 0.71 is __
Sketch the area under the standard normal curve over the indicated interval and find the specified...
Sketch the area under the standard normal curve over the indicated interval and find the specified area. (Enter a number. Round your answer to four decimal places.) The area to the left of z = 0.44 is .
Sketch the area under the standard normal curve over the indicated interval and find the specified...
Sketch the area under the standard normal curve over the indicated interval and find the specified area. (Enter a number. Round your answer to four decimal places.) The area to the left of z = 0.42 is
Use a table of areas for the standard normal curve to find the required z-score. 5)...
 Use a table of areas for the standard normal curve to find the required z-score. 5) Find the z-score having area 0.09 to its left under the standard normal curve.
 Question 4 2 pts Use StatKey to find the endpoint with the given property: . The area to the right of the endpoint on a N(500,26) curve is about 0.05. Endpoint 457.234 473.846 523.223 542.766 4 pts Question 5 Use StatKey to identify the answer closest to the specified areas for a N(0, 1) density. The area to the left of z = 1.52. Area = [Select] The area between z = 0.31 and z = 1.79. Area = [Select)...
 Use a table of areas for the standard normal curve to find the required z-score. 5) Find the z-score having area 0.09 to its left under the standard normal curve.
Most questions answered within 3 hours.
-
20% of all customers subscribe to phone service.
70% of all customers subscribe to internet service....
asked 6 minutes ago -
Write a program to solve the Josephus problem, with the following
modification:
Sample Input:
./a.out n...
asked 2 hours ago -
At the start of a CD it is spinning at a rate of 525 rpm
(revolutions...
asked 3 hours ago -
4. Without doing any calculations, predict whether the observed
∆T would increase, decrease or remain the...
asked 4 hours ago -
Based on the range, which of the following sets of scores has
the greatest variability? 3,...
asked 5 hours ago -
Ripples in a pond travel at a velocity of 3 m/s with one peak
passing a...
asked 5 hours ago -
A man stands on the roof of a building of height 13.0 mm and
throws a...
asked 5 hours ago -
The extent to which assets are financed by borrowed funds and
other liabilities is indicated by:...
asked 6 hours ago -
Explain in detail
Germany is the fifth largest economy
explain what goods and services Germany specializes...
asked 6 hours ago -
The density of platinum is 21.45 g/mL. If a cube of platinum
with a mass of...
asked 7 hours ago -
Accounts Receivable
Sales
A/R Posting
Extended Sales Invoice
Packing Slip
Compare invoice to packing slip 2...
asked 7 hours ago -
Michaella, age 23, is a full-time law student and is claimed by
her parents as a...
asked 7 hours ago