
Homework Answers
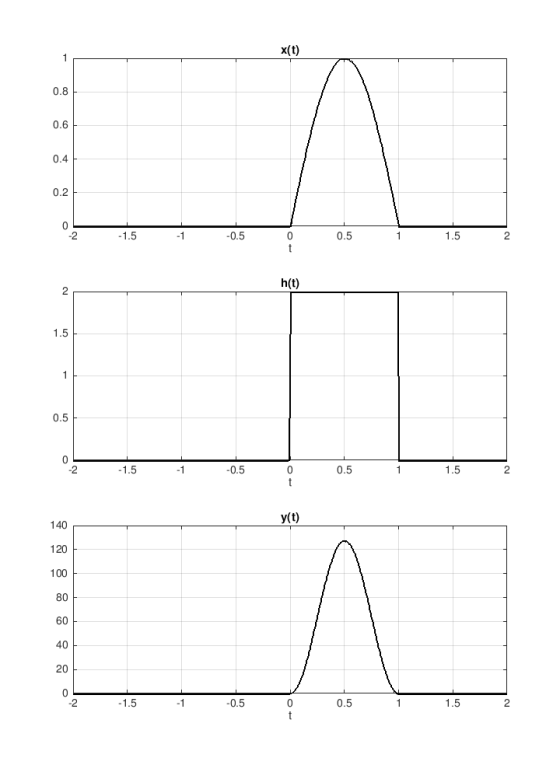
(3.1) Let draw the signals using computer through MATLAB
MATLAB CODE:
clc
clear all
close all
t = -2:0.01:2;
m = 2*length(t)-1; % Length of Output
y(t)
n = linspace(-2,2,m);
u1 = t >= 0;
u2 = t >= 1;
x = sin(pi.*t).*(u1-u2); % Input x(t)
h =
2.*(u1-u2); %
Impulse h(t)
y =
conv(x,h);
% Output y(t)
subplot(3,1,1)
plot(t,x,'k','LineWidth',2)
xlabel('t')
title('x(t)')
grid on
subplot(3,1,2)
plot(t,h,'k','LineWidth',2)
xlabel('t')
title('h(t)')
grid on
subplot(3,1,3)
plot(n,y,'k','LineWidth',2)
xlabel('t')
title('y(t)')
grid on
OUTPUT:
Add Answer to:
3. Sketch stuff (by hand or by computer) 3.1 Systems signals The signal x()-sin^t), for 0stsl;...
3. Sketch solutions (a) The signal x(t)-sint), for 0sts1; is applied to a circuit with an...
 3. Sketch solutions (a) The signal x(t)-sint), for 0sts1; is applied to a circuit with an impulse response given by ht)-2, for 0sts1. Sketch these signals and the output of the circuit (b)If the input signal is now set to x(t)-6(t-3), sketch the input and output signals.
The given input signal for 2.7.2 is: x(t) = 3 cos(2 π t) + 6 sin(5 π t). Plz explain ...
 The given input signal for 2.7.2 is: x(t) = 3 cos(2
π t) + 6 sin(5 π t).Plz explain steps.Given a causal LTI system described by the differential equation find \(H(s),\) the \(\mathrm{ROC}\) of \(H(s),\) and the impulse response \(h(t)\) of the system. Classify the system as stable/unstable. List the poles of \(H(s) .\) You should the Matlab residue command for this problem.(a) \(y^{\prime \prime \prime}+3 y^{\prime \prime}+2 y^{\prime}=x^{\prime \prime}+6 x^{\prime}+6 x\)2.7.2 The signal \(x(t)\) in the previous problem is...
The given input signal for 2.7.2 is: x(t) = 3 cos(2
π t) + 6 sin(5 π t).Plz explain steps.Given a causal LTI system described by the differential equation find \(H(s),\) the \(\mathrm{ROC}\) of \(H(s),\) and the impulse response \(h(t)\) of the system. Classify the system as stable/unstable. List the poles of \(H(s) .\) You should the Matlab residue command for this problem.(a) \(y^{\prime \prime \prime}+3 y^{\prime \prime}+2 y^{\prime}=x^{\prime \prime}+6 x^{\prime}+6 x\)2.7.2 The signal \(x(t)\) in the previous problem is...
2.45,2.48 explain clearly please Signals and Systems: A Primer with MATLAB 104 20 1H y(t) x(t)...
 2.45,2.48 explain clearly please
Signals and Systems: A Primer with MATLAB 104 20 1H y(t) x(t) FIGURE 2.38 For Problem 2.48. 2.45 An accumulator has impulse response h[n] = u[n]. Check if an accumulator is BIBO stable 2.46 The input to the circuit discussed in Example 2.15 is v,) ut - )dt - 2) Use convolution to determine the output 2.47 Determine the output of the circuit discussed in Practice Problem 2.15 if v,) u() 2.48 If the filter in...
2.45,2.48 explain clearly please
Signals and Systems: A Primer with MATLAB 104 20 1H y(t) x(t) FIGURE 2.38 For Problem 2.48. 2.45 An accumulator has impulse response h[n] = u[n]. Check if an accumulator is BIBO stable 2.46 The input to the circuit discussed in Example 2.15 is v,) ut - )dt - 2) Use convolution to determine the output 2.47 Determine the output of the circuit discussed in Practice Problem 2.15 if v,) u() 2.48 If the filter in...
SIGNALS and SYSTEMS HOMEWORK-IV 1. Let X(t) be the input to an LTI system with unit...
 SIGNALS and SYSTEMS HOMEWORK-IV 1. Let X(t) be the input to an LTI system with unit impulse response h(t), where x(t) = e-tu(t) h(t) = u(t -3). Determine and plot the output y(t) = x(t) *h(t). Both analytically and graphical method. (25 p)
Create chart or table Consider the system with the impulse response ht)e u(t), as shown in Figure...
 Create chart or table Consider the system with the impulse response ht)e u(t), as shown in Figure 3.2(a). This system's response to an input of x(t) 1) would be y(t) h(r ult 1). as shown in Figure 3.2(b). If the input signal is a sum of weighted, time-shifted impulses as described by (3.10), separated in time by Δ = 0.1 (s) so that xt)01-0.1k), as shown in Figure 3.2(c), then, according to (3.11), the output is This output signal is...
Signals and Systems Nyquist Rate of signal is? X(t) = sin( 500 TT4) Sin caso trd)...
 Signals and Systems
Nyquist Rate of signal is? X(t) = sin( 500 TT4) Sin caso trd) Tit + cos² (1000it) sin (400 T7E) Tt
Signals and Systems
Nyquist Rate of signal is? X(t) = sin( 500 TT4) Sin caso trd) Tit + cos² (1000it) sin (400 T7E) Tt
Problem 4: [10 Points A LTIC systems has impulse response as showm betlow t h(t) Using analytical or graphical convolution, find and sketch the system's output yto if the input x (t) is: x(t)...
 Problem 4: [10 Points A LTIC systems has impulse response as showm betlow t h(t) Using analytical or graphical convolution, find and sketch the system's output yto if the input x (t) is: x(t):#6(t) _ 26(t-1)[31 a) b) x(o) - rect ()17 Solution:
Problem 4: [10 Points A LTIC systems has impulse response as showm betlow t h(t) Using analytical or graphical convolution, find and sketch the system's output yto if the input x (t) is: x(t):#6(t) _ 26(t-1)[31 a)...
Problem 4: [10 Points A LTIC systems has impulse response as showm betlow t h(t) Using analytical or graphical convolution, find and sketch the system's output yto if the input x (t) is: x(t):#6(t) _ 26(t-1)[31 a) b) x(o) - rect ()17 Solution:
Problem 4: [10 Points A LTIC systems has impulse response as showm betlow t h(t) Using analytical or graphical convolution, find and sketch the system's output yto if the input x (t) is: x(t):#6(t) _ 26(t-1)[31 a)...
In each step to follow, the signals h(t), a(t), and y(t) denote respectively the impulse response...
 In each step to follow, the signals h(t), a(t), and y(t) denote respectively the impulse response, input, and output of a continuous-time LTI system. Accordingly, H(w), X(w) and Y(w) denote their Fourier transforms. Hint: Carefully consider for each step whether to work in the time domain or frequency domain. (b) (25 points) On the axes below, provide a clearly labeled sketch of y(t) for all t given Σ H(w)-( ) sine? (w/8) j2Tt r(t)-e δ(t-n/2) and with sinc(t) = sin(t)/t...
6- A contiuous-time periodic signal x(t) is given graphically below. (a) Determine the exponential Fourier coefficients...
 6- A contiuous-time periodic signal x(t) is given graphically below. (a) Determine the exponential Fourier coefficients for k+oo a ()-ΣGeko, k-oo where c is given by T/2 1 (t)ek dt J-T/2 Ck= T (b) r(t) is applied as an input to an LTI system whose frequency response is H(ju)=2 sin(w Determine the corresponding output y(t) (e) Sketch y(t). Be sure to mark the axes properly -JT
6- A contiuous-time periodic signal x(t) is given graphically below. (a) Determine the exponential...
6- A contiuous-time periodic signal x(t) is given graphically below. (a) Determine the exponential Fourier coefficients for k+oo a ()-ΣGeko, k-oo where c is given by T/2 1 (t)ek dt J-T/2 Ck= T (b) r(t) is applied as an input to an LTI system whose frequency response is H(ju)=2 sin(w Determine the corresponding output y(t) (e) Sketch y(t). Be sure to mark the axes properly -JT
6- A contiuous-time periodic signal x(t) is given graphically below. (a) Determine the exponential...
Hello, Can anyone help me with these questions from signals and systems course? Thank you in...
 Hello,
Can anyone help me with these questions from signals and
systems course?
Thank you in advance??♀️
Problem 1 [25 points : Consider the following periodic signal x(t). Determine the Fourier series coefficients, ak nu Problem 2 [25 points : Determine the Fourier series coefficients, ax and the average power for the periodic signal x(t) shown. -2 -1 1 2 Problem 350 points: Let x(t) be the input signal to an LTI system with impulse response h(t) and let y(t)...
Hello,
Can anyone help me with these questions from signals and
systems course?
Thank you in advance??♀️
Problem 1 [25 points : Consider the following periodic signal x(t). Determine the Fourier series coefficients, ak nu Problem 2 [25 points : Determine the Fourier series coefficients, ax and the average power for the periodic signal x(t) shown. -2 -1 1 2 Problem 350 points: Let x(t) be the input signal to an LTI system with impulse response h(t) and let y(t)...
 3. Sketch solutions (a) The signal x(t)-sint), for 0sts1; is applied to a circuit with an impulse response given by ht)-2, for 0sts1. Sketch these signals and the output of the circuit (b)If the input signal is now set to x(t)-6(t-3), sketch the input and output signals.
 The given input signal for 2.7.2 is: x(t) = 3 cos(2
π t) + 6 sin(5 π t).Plz explain steps.Given a causal LTI system described by the differential equation find \(H(s),\) the \(\mathrm{ROC}\) of \(H(s),\) and the impulse response \(h(t)\) of the system. Classify the system as stable/unstable. List the poles of \(H(s) .\) You should the Matlab residue command for this problem.(a) \(y^{\prime \prime \prime}+3 y^{\prime \prime}+2 y^{\prime}=x^{\prime \prime}+6 x^{\prime}+6 x\)2.7.2 The signal \(x(t)\) in the previous problem is...
The given input signal for 2.7.2 is: x(t) = 3 cos(2
π t) + 6 sin(5 π t).Plz explain steps.Given a causal LTI system described by the differential equation find \(H(s),\) the \(\mathrm{ROC}\) of \(H(s),\) and the impulse response \(h(t)\) of the system. Classify the system as stable/unstable. List the poles of \(H(s) .\) You should the Matlab residue command for this problem.(a) \(y^{\prime \prime \prime}+3 y^{\prime \prime}+2 y^{\prime}=x^{\prime \prime}+6 x^{\prime}+6 x\)2.7.2 The signal \(x(t)\) in the previous problem is...
 2.45,2.48 explain clearly please
Signals and Systems: A Primer with MATLAB 104 20 1H y(t) x(t) FIGURE 2.38 For Problem 2.48. 2.45 An accumulator has impulse response h[n] = u[n]. Check if an accumulator is BIBO stable 2.46 The input to the circuit discussed in Example 2.15 is v,) ut - )dt - 2) Use convolution to determine the output 2.47 Determine the output of the circuit discussed in Practice Problem 2.15 if v,) u() 2.48 If the filter in...
2.45,2.48 explain clearly please
Signals and Systems: A Primer with MATLAB 104 20 1H y(t) x(t) FIGURE 2.38 For Problem 2.48. 2.45 An accumulator has impulse response h[n] = u[n]. Check if an accumulator is BIBO stable 2.46 The input to the circuit discussed in Example 2.15 is v,) ut - )dt - 2) Use convolution to determine the output 2.47 Determine the output of the circuit discussed in Practice Problem 2.15 if v,) u() 2.48 If the filter in...
 SIGNALS and SYSTEMS HOMEWORK-IV 1. Let X(t) be the input to an LTI system with unit impulse response h(t), where x(t) = e-tu(t) h(t) = u(t -3). Determine and plot the output y(t) = x(t) *h(t). Both analytically and graphical method. (25 p)
 Create chart or table Consider the system with the impulse response ht)e u(t), as shown in Figure 3.2(a). This system's response to an input of x(t) 1) would be y(t) h(r ult 1). as shown in Figure 3.2(b). If the input signal is a sum of weighted, time-shifted impulses as described by (3.10), separated in time by Δ = 0.1 (s) so that xt)01-0.1k), as shown in Figure 3.2(c), then, according to (3.11), the output is This output signal is...
 Signals and Systems
Nyquist Rate of signal is? X(t) = sin( 500 TT4) Sin caso trd) Tit + cos² (1000it) sin (400 T7E) Tt
Signals and Systems
Nyquist Rate of signal is? X(t) = sin( 500 TT4) Sin caso trd) Tit + cos² (1000it) sin (400 T7E) Tt
 Problem 4: [10 Points A LTIC systems has impulse response as showm betlow t h(t) Using analytical or graphical convolution, find and sketch the system's output yto if the input x (t) is: x(t):#6(t) _ 26(t-1)[31 a) b) x(o) - rect ()17 Solution:
Problem 4: [10 Points A LTIC systems has impulse response as showm betlow t h(t) Using analytical or graphical convolution, find and sketch the system's output yto if the input x (t) is: x(t):#6(t) _ 26(t-1)[31 a)...
Problem 4: [10 Points A LTIC systems has impulse response as showm betlow t h(t) Using analytical or graphical convolution, find and sketch the system's output yto if the input x (t) is: x(t):#6(t) _ 26(t-1)[31 a) b) x(o) - rect ()17 Solution:
Problem 4: [10 Points A LTIC systems has impulse response as showm betlow t h(t) Using analytical or graphical convolution, find and sketch the system's output yto if the input x (t) is: x(t):#6(t) _ 26(t-1)[31 a)...
 In each step to follow, the signals h(t), a(t), and y(t) denote respectively the impulse response, input, and output of a continuous-time LTI system. Accordingly, H(w), X(w) and Y(w) denote their Fourier transforms. Hint: Carefully consider for each step whether to work in the time domain or frequency domain. (b) (25 points) On the axes below, provide a clearly labeled sketch of y(t) for all t given Σ H(w)-( ) sine? (w/8) j2Tt r(t)-e δ(t-n/2) and with sinc(t) = sin(t)/t...
 6- A contiuous-time periodic signal x(t) is given graphically below. (a) Determine the exponential Fourier coefficients for k+oo a ()-ΣGeko, k-oo where c is given by T/2 1 (t)ek dt J-T/2 Ck= T (b) r(t) is applied as an input to an LTI system whose frequency response is H(ju)=2 sin(w Determine the corresponding output y(t) (e) Sketch y(t). Be sure to mark the axes properly -JT
6- A contiuous-time periodic signal x(t) is given graphically below. (a) Determine the exponential...
6- A contiuous-time periodic signal x(t) is given graphically below. (a) Determine the exponential Fourier coefficients for k+oo a ()-ΣGeko, k-oo where c is given by T/2 1 (t)ek dt J-T/2 Ck= T (b) r(t) is applied as an input to an LTI system whose frequency response is H(ju)=2 sin(w Determine the corresponding output y(t) (e) Sketch y(t). Be sure to mark the axes properly -JT
6- A contiuous-time periodic signal x(t) is given graphically below. (a) Determine the exponential...
 Hello,
Can anyone help me with these questions from signals and
systems course?
Thank you in advance??♀️
Problem 1 [25 points : Consider the following periodic signal x(t). Determine the Fourier series coefficients, ak nu Problem 2 [25 points : Determine the Fourier series coefficients, ax and the average power for the periodic signal x(t) shown. -2 -1 1 2 Problem 350 points: Let x(t) be the input signal to an LTI system with impulse response h(t) and let y(t)...
Hello,
Can anyone help me with these questions from signals and
systems course?
Thank you in advance??♀️
Problem 1 [25 points : Consider the following periodic signal x(t). Determine the Fourier series coefficients, ak nu Problem 2 [25 points : Determine the Fourier series coefficients, ax and the average power for the periodic signal x(t) shown. -2 -1 1 2 Problem 350 points: Let x(t) be the input signal to an LTI system with impulse response h(t) and let y(t)...
Most questions answered within 3 hours.
-
(a) A piston at 6.1 atm contains a gas that occupies a volume of
3.5 L....
asked 59 minutes ago -
Please answer true or false. Words
cannot be changed or added in to make it true...
asked 58 minutes ago -
An empty test tube weighs 15.923 grams. Then,
MgCl2•6H2O is added into the test tube. After...
asked 1 hour ago -
Assume memory access is 10 units of time and disk access is
10000 units of time....
asked 1 hour ago -
1. Are all good samples random?
2. Magazines often report surveys giving statistics such as “63%...
asked 1 hour ago -
Under all the various types of market structures, firms
must eventually earn some economic profits for...
asked 1 hour ago -
Consider the following fitness regime for a single locus trait
with two co-dominant alleles: w11 =...
asked 1 hour ago -
A large cable company reports the following.
80% of its customers subscribe to its cable TV...
asked 1 hour ago -
Please answer the question in brief.
Discuss the role of ERP in organizations. Are ERP tools...
asked 1 hour ago -
Discuss the pros and cons of collaborative software such
as SameTime. Does it increase productivity? What...
asked 1 hour ago -
Buying your in-laws a gift because it’s expected is
due to the ____________ motive of gift-giving....
asked 1 hour ago -
Calculate the expected value, the variance, and the standard
deviation of the given random variable X....
asked 2 hours ago