The table below lists the electricity bills (monthly) of Mali Island comprising of 71 customers. Electricity...
The table below lists the electricity bills (monthly) of Mali Island comprising of 71 customers.
|
Electricity Bills monthly |
|||||||||
|
52.30 |
55.61 |
55.71 |
58.01 |
58.41 |
58.51 |
58.91 |
62.33 |
62.50 |
62.71 |
|
67.13 |
67.23 |
69.51 |
69.67 |
69.80 |
69.82 |
71.34 |
71.65 |
71.83 |
72.15 |
|
77.22 |
72.41 |
72.59 |
72.67 |
75.11 |
75.71 |
75.82 |
79.03 |
79.06 |
79.09 |
|
79.15 |
79.28 |
79.32 |
79.51 |
79.62 |
82.32 |
82.61 |
85.09 |
85.13 |
85.25 |
|
85.31 |
85.41 |
85.51 |
85.58 |
89.21 |
89.32 |
89.49 |
89.61 |
89.78 |
92.41 |
|
92.63 |
92.89 |
93.05 |
93.19 |
93.28 |
93.91 |
94.17 |
94.28 |
94.31 |
94.52 |
|
94.71 |
95.32 |
95.51 |
104.31 |
104.71 |
105.21 |
105.37 |
105.71 |
109.34 |
115.71 |
|
119.38 |
|||||||||
a. Group the above data using seven 7 class intervals, each of size 10, and display on a frequency table.
b. Use Microsoft Excel to construct a histogram for the data obtained in (a).
Homework Answers
a) The minimum value in this dataset is 52.3 and the maximum is 119.3
We can start the lower limit of the first class at 52. The lower limit of the next class is obtained by adding the class width 10.
We obtain the following limits for 7 classes
| Lower limit |
| 52 |
| 62 |
| 72 |
| 82 |
| 92 |
| 102 |
| 112 |
Next we can see that the electricity bills have a resolution of 0.01. That is the values are measured to an accuracy of 2 decimals. We will get the upper limit of a class by subtracting 0.01 from the lower limit of the next class. For example, the upper limit of class 1 is 62-0.01=61.99
We get the following table
| Lower limit | Upper Limit |
| 52 | 61.99 |
| 62 | 71.99 |
| 72 | 81.99 |
| 82 | 91.99 |
| 92 | 101.99 |
| 102 | 111.99 |
| 112 | 121.99 |
To get the upper limit of the last class, we get the lower limit of the imaginary 8th class to be 122.
Next we count the number of observations that fall in each interval. For example, the following 7 observations fall within the interval of the first class, 52-61.99
| 52.3 | 55.61 | 55.71 | 58.01 | 58.41 | 58.51 | 58.91 |
And hence the frequency of the first class is 7
We get the following frequency table
ans:
| class | Frequency |
| 52-61.99 | 7 |
| 62-71.99 | 12 |
| 72-81.99 | 16 |
| 82-91.99 | 14 |
| 92-101.99 | 14 |
| 102-111.99 | 6 |
| 112-121.99 | 2 |
b) select the table and use insert-->2D column-->Clustered
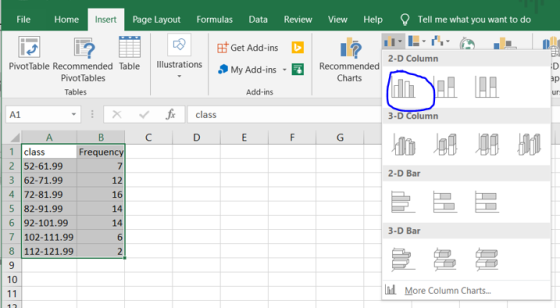
to get this raw graph

format as needed

Add Answer to:
The table below
lists the electricity bills (monthly) of Mali Island comprising of
71 customers.
Electricity...
Most questions answered within 3 hours.
-
Kylie is a single mom with two dependent children,
Tanner, age 7 and Olivia, age 11....
asked 1 hour ago -
Phosphorous + bromine = phosphorous tribromide. If 35.0 g of
bromine are reacted and 27.9 grams...
asked 2 hours ago -
Derive the long wavelength limit of the Planck energy density
distribution
asked 2 hours ago -
Calculate the pH of each of the following solutions.
0.50 M HBr
3.1×10⁻⁴ M KOH
4.2×10⁻⁵...
asked 6 hours ago -
For the year ended December 31, Depot Max’s cost of merchandise
sold was $85,600. Inventory at the...
asked 6 hours ago -
Week 10 - Professional Memo Assignment
Professional Memo Assignment
Your mission for this week, should you...
asked 6 hours ago -
Write a Python program that stores the data for each
player on the team, and it...
asked 6 hours ago -
In
the last 3 months, mike never knows when he is going to get his
allowance...
asked 6 hours ago -
Is Ca(OH)2 a Bronsted base, Lewis base, or both? Why?
asked 6 hours ago -
1A- Why don’t voters complain about U.S. tariffs on imported
sugar?
Because sugar is only a...
asked 6 hours ago -
Cash Payback Period
Primera Banco is evaluating two capital investment proposals for
a drive-up ATM kiosk,...
asked 6 hours ago -
Create a button in Swift (Xcode) that will create a charge,
create a charge using Stripe's...
asked 6 hours ago