Use the curve of cumulative demand and short term cumulative supply, in order to show what...
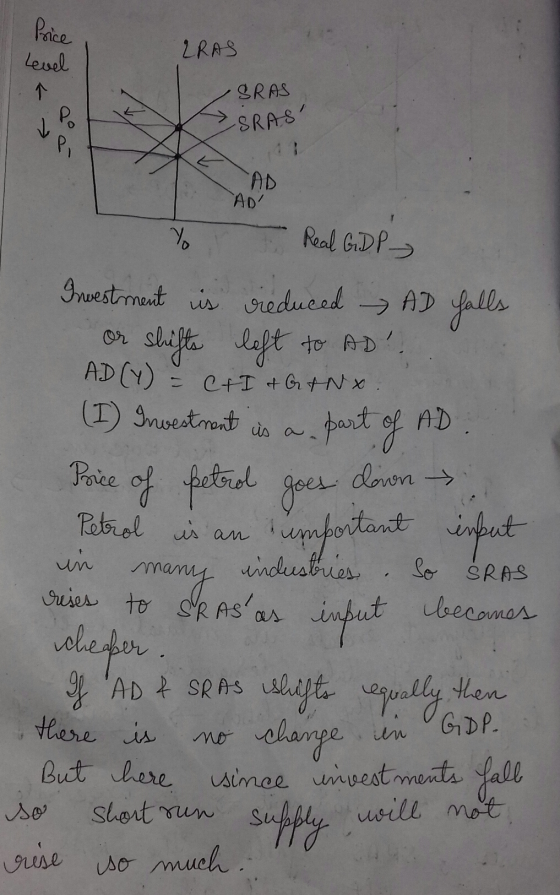
Use the curve of cumulative demand and short term cumulative supply, in order to show what happens when investment is reduced while the price of the petrol goes down. b. How can government react after the aforementioned changes so that the short term GDP will be stabilized to the initial point and how this will affect prices? Show the new balance at the same diagram
Homework Answers

Add Answer to:
Use the curve of cumulative demand and short term cumulative
supply, in order to show what...
1. Aggregate supply definitions The short-run aggregate supply curve shows: What happens to output in an...
 1. Aggregate supply definitions The short-run aggregate supply curve shows: What happens to output in an economy when the government spends more money How firms respond to changes in interest rates Changes in output in an economy as the price level changes, holding all other determinants of real GDP constar The relationship between the price level and aggregate expenditure Which of the following are assumed to remain unchanged along a given short-run aggregate supply curve? Check all that The price...
1. Which of the following is not a property of the aggregate demand curve? It shows...
1. Which of the following is not a property of the aggregate demand curve? It shows the relationship between the overall price level and level consumption. It shows the price level on the vertical axis and output on the horizontal axis. The aggregate demand curve slopes downward. It shows the relationship between the overall price level and the level of total demand. 2. When the price level increases people: feel more wealthy. have the same real value of assets, regardless...
Using the IS-LM and Aggregate Supply-Aggregate Demand (AS-AD) models of Chapter 12 with a flat short-run...
 Using the IS-LM and Aggregate Supply-Aggregate Demand (AS-AD) models of Chapter 12 with a flat short-run AS curve (that is, completely sticky prices), suppose the economy is at the natural rate of unemployment and so, at long-run equilibrium. Suddenly, taxes are reduced with no change in government spending. Tell me (or show on a graph) what happens to the IS and/or LM curves. Show on a different graph what happens on the AS-AD diagram in the short-run (drawing in the...
When the aggregate demand curve and the short-run aggregate supply curve intersect, a) the long-run aggregate...
 When the aggregate demand curve and the short-run aggregate supply curve intersect, a) the long-run aggregate supply curve must also intersect at the same point. Ob) the economy must experience higher output than the natural level of output. o c) the economy must experience lower output than the natural level of output. o d) the economy is in short-run macroeconomic equilibrium. In a small economy in 2016, aggregate expenditure was $900 million while GDP that year was $750 million. Which...
2 0) Draw and label a supply and demand diagram with a short run supply curve....
 2 0) Draw and label a supply and demand diagram with a short run supply curve. (ii) Shift out the demand curve and show the short run effect on output and price. (iii) Show the long run effect on price by drawing a second short run supply curve. Use this short run supply curve to trace out the position of the long run supply curve. Do (). (ii) and a. a constant cost industry and b. an increasing cost industry...
Working with supply and demand curves. Draw a supply and demand curve and show the equilibrium...
Working with supply and demand curves. Draw a supply and demand curve and show the equilibrium price and quantity. (5 pts) B. Assume that the good is a normal good and that income increases. What happens to equilibrium price and quantity? Show graphically and describe in words. (5 pts) 2. Suppose that the own price elasticity of demand for physician visits is 0.5. A. What happens to the demand for physician visits if price goes up by 20%? Explain. (5...
In the Keynesian zone of the aggregate supply curve, how is Keynes’ law, where demand creates...
In the Keynesian zone of the aggregate supply curve, how is Keynes’ law, where demand creates its own supply, illustrated? Prices change relatively little with an increasing aggregate demand, but that changing demand does effectively increase aggregate outputs because of the excess capacity in the economy. Because the economy is closer to full output, aggregate demand either increasing or decreasing has a large effect on prices and little effect on aggregate supply. Prices remain relatively static and outputs remain unchanged...
8. Suppose the government borrows $20 billion more next year than this year. a. Use a supply-and-demand diagram to...
 8. Suppose the government borrows $20 billion more next year than this year. a. Use a supply-and-demand diagram to analyze this policy. Does the interest rate rise or fall? b. What happens to investment? To private saving? To public saving? To national saving? Compare the size of the changes to the $20 billion of extra government borrowing. c. How does the elasticity of supply of loanable funds affect the size of these changes? d. How does the elasticity of demand...
2. Use the model of aggregate demand and short-run aggregate supply to explain how each of...
 2. Use the model of aggregate demand and short-run aggregate supply to explain how each of the following would affect real GDP and the price level in the short run. a. an increase in government purchases b.a reduction in nominal wages c. a major improvement in technology d. a reduction in net exports
NOSSASSINS Use demand and supply analysis to answer each of the following questions. Assume that the...
 NOSSASSINS Use demand and supply analysis to answer each of the following questions. Assume that the respective market is in equilibrium before the change takes place. Graphically analyze whether there is a movement or a shift in the appropriate curve and then determine the effect on the equilibrium price and quantity. Draw a separate diagram for each question in each market. In the wheat market: A new fertilizer is developed with a lower cost The government imposes a new tax...
 1. Aggregate supply definitions The short-run aggregate supply curve shows: What happens to output in an economy when the government spends more money How firms respond to changes in interest rates Changes in output in an economy as the price level changes, holding all other determinants of real GDP constar The relationship between the price level and aggregate expenditure Which of the following are assumed to remain unchanged along a given short-run aggregate supply curve? Check all that The price...
 Using the IS-LM and Aggregate Supply-Aggregate Demand (AS-AD) models of Chapter 12 with a flat short-run AS curve (that is, completely sticky prices), suppose the economy is at the natural rate of unemployment and so, at long-run equilibrium. Suddenly, taxes are reduced with no change in government spending. Tell me (or show on a graph) what happens to the IS and/or LM curves. Show on a different graph what happens on the AS-AD diagram in the short-run (drawing in the...
 When the aggregate demand curve and the short-run aggregate supply curve intersect, a) the long-run aggregate supply curve must also intersect at the same point. Ob) the economy must experience higher output than the natural level of output. o c) the economy must experience lower output than the natural level of output. o d) the economy is in short-run macroeconomic equilibrium. In a small economy in 2016, aggregate expenditure was $900 million while GDP that year was $750 million. Which...
 2 0) Draw and label a supply and demand diagram with a short run supply curve. (ii) Shift out the demand curve and show the short run effect on output and price. (iii) Show the long run effect on price by drawing a second short run supply curve. Use this short run supply curve to trace out the position of the long run supply curve. Do (). (ii) and a. a constant cost industry and b. an increasing cost industry...
 8. Suppose the government borrows $20 billion more next year than this year. a. Use a supply-and-demand diagram to analyze this policy. Does the interest rate rise or fall? b. What happens to investment? To private saving? To public saving? To national saving? Compare the size of the changes to the $20 billion of extra government borrowing. c. How does the elasticity of supply of loanable funds affect the size of these changes? d. How does the elasticity of demand...
 2. Use the model of aggregate demand and short-run aggregate supply to explain how each of the following would affect real GDP and the price level in the short run. a. an increase in government purchases b.a reduction in nominal wages c. a major improvement in technology d. a reduction in net exports
 NOSSASSINS Use demand and supply analysis to answer each of the following questions. Assume that the respective market is in equilibrium before the change takes place. Graphically analyze whether there is a movement or a shift in the appropriate curve and then determine the effect on the equilibrium price and quantity. Draw a separate diagram for each question in each market. In the wheat market: A new fertilizer is developed with a lower cost The government imposes a new tax...
Most questions answered within 3 hours.
-
R2.84: There are 2 defective products in a production lot of 10.
An inspector randomly selected...
asked 1 hour ago -
Consider the following equilibrium system: COCl2(g) CO(g) +
Cl2(g) A 10.00 L evacuated flask is filled...
asked 1 hour ago -
1) What are the two distinct steps that one needs to perform
when developing a data...
asked 1 hour ago -
2) Write a C++ program that uses a class called “Degree” to
obtain the trigonometric
values...
asked 2 hours ago -
1. In eukaryotic cells the genomes of
&
asked 2 hours ago -
The standard enthalpy of propanol (C3H7OH) is -303.0 kJ/mol.
Compute both of the
gross and net...
asked 2 hours ago -
Why PWM using H-bridge for control motor speed is more power
effiecient than the linear amplifier...
asked 2 hours ago -
In 1999, Carly Fiorina famously said,"I hope that we are at a
point that everyone is...
asked 2 hours ago -
Individuals in a species of moth vary in wing color from white to
black, but all...
asked 3 hours ago -
The following standards for variable manufacturing overhead have
been established for a company that makes only...
asked 3 hours ago -
The United States government wanted to determine what proportion
of Americans approve of the current president,...
asked 3 hours ago -
2-N stone is dropped from the top of a cliff. The stone hits the
ground 3...
asked 3 hours ago