Suppose the market for nurses can be modeled using supply and demand (the market is perfectly...
Suppose the market for nurses can be modeled using supply and demand (the market is perfectly competitive). There are a large number of hospitals, doctors’ offices, clinics, etc., so that no individual employer has an impact on the market wage. The nurses are not unionized so they individually have no impact on the wage.
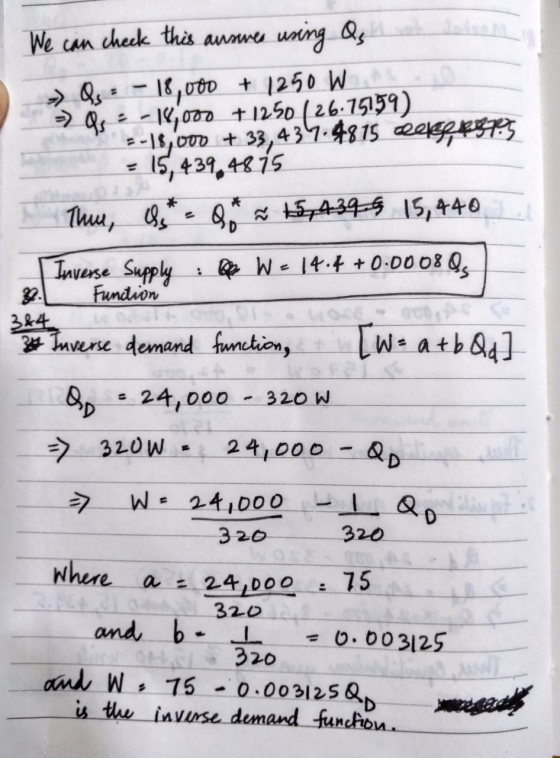
Demand is given as Qd = 24,000 – 320W, where Qd is the quantity demanded (in full-time equivalents) and W is the hourly wage rate.
Supply is given as Qs = -18,000 + 1250W, where Qs is the quantity supplied.
- Find the equilibrium wage rate. This is done by setting the quantity demanded equal to the quantity supplied and algebraically solving for W. That is, solve the following equation for W:
24,000 – 320W = -18,000 + 1250W
- Find the equilibrium quantity. Plug your answer from (1) into either the supply or demand function to get Q. Or, better yet, plug it into both to make sure you get the same answer. If you don’t, you have the wrong answer for 1.
If, at this point, you have a negative wage or negative quantity, you’ve made an error and should start over.
Another way to solve the above problems would be to derive the ‘inverse demand curve’ and the ‘inverse supply curve.’ The inverse supply curve gives the wage as a function of the quantity supplied. Given the supply function above, the inverse supply function is:
W = 14.4 + 0.0008Qs
Be sure you can duplicate the above answer before moving on to 3.
3 and 4. Derive the inverse demand function. It should take the form W = a + bQd, where a and b are derived from the demand function’s parameters. You will report a as the answer to (3) and b as the answer to (4). b should be reported to 6 decimal places.
If you set the inverse demand function equal to the inverse supply function you can solve for the equilibrium quantity (while you have Qd and Qs in the equations, you can make use of the fact that, in equilibrium, Qd = Qs, so that you are simply solving for Q).
5. What is the wage rate using the above approach?
Homework Answers


Add Answer to:
Suppose the market for nurses can be modeled using supply and
demand (the market is perfectly...
Consider a perfectly competitive market where Demand is described as Qd 100-2P. a. If the market...
 Consider a perfectly competitive market where Demand is described as Qd 100-2P. a. If the market price is 10, how many units are consumed in the market? What is the consumer surplus in the market? b. Suppose the market Supply is described as Qs 10 P. What is the equilibrium price in the market? Quantity? C. Suppose the market Supply is described as Qs 10+ P. What is the excess quantity supplied in the market at P demanded in the...
DEMAND & SUPPLY: Consider the market for bananas which is known to be perfectly competitive. The...
DEMAND & SUPPLY: Consider the market for bananas which is known to be perfectly competitive. The market is characterized by the following relationships: QD = 10,000 – 140P QS = 7500 + 125P Plot the demand curve and the supply curve on a graph. Clearly label the axes and the intercepts. Why is the demand-curve downward-sloping? What is the slope of the demand curve? Why is the supply-curve upward-sloping? What is the slope of the supply curve? What is the...
For Question 1-8, consider a competitive market for a good where the demand curve is determined...
For Question 1-8, consider a competitive market for a good where the demand curve is determined by the demand function: P=5-QD and the supply curve is determined by the supply function: P=QS. Where P stands for Price, QD is quantity demanded and QS is quantity supplied. What is the equilibrium price level for the good in the competitive market?
1. The market for a product is defined by the following demand and supply curves: &nbs
1. The market for a product is defined by the following demand and supply curves: Qd=20-7p Qs=-4+5P where Qd and Qs are the quantities demanded and supplied, and P is the price of the product in £s. (i) Draw (accurately) a diagram to depict the market for this product and determine the equilibrium price and quantity. (ii) Solve for the equilibrium market price and quantity mathematically (remember that, in equilibrium, Qd=Qs).
Demand, Supply and Equilibrium: Given the following equations representing the behavior of producers and consumers:...
Demand, Supply and Equilibrium: Given the following equations representing the behavior of producers and consumers: Price Quantity Demanded Qd Quantity Supplied Qs 52 48 44 40 35 32 29 26 24 Consumers: Qd = 3,380 - 35P, Producers: Qs =95P, (P: Price) (Qd: quantity demanded, Qs: Quantity supplied ) What price corresponds to the equilibrium price for this market? (1%) What is the equilibrium quantity? Over what range of prices does a Surplus result? Over what range of...
This problem involves solving demand and supply equations todetermine equilibrium Price and Quantity and then...
This problem involves solving demand and supply equations to determine equilibrium Price and Quantity and then illustrating them graphically.Consider a demand curve of the form : QD= -3P + 45 where QD is the quantity demanded and P is the price of the good.The supply curve for the same good is: QS= P-5 where QS is the quantity supplied at price, P. Solve for equilibrium Price (P*) and Quantity (Q*). Please set up the problem and underline your answers below....
A market is described by the following supply and demand curves: Qs = 3P Qd =...
 A market is described by the following supply and demand curves: Qs = 3P Qd = 400-P The equilibrium price is S and the equilibrium quantity is Suppose the government imposes a price ceiling of $80. This price ceiling is , and the market price will be supplied will be . and the quantity demanded will be . Therefore, a price calling of $60 will result in the quantity the quantity Suppose the government imposes a price floor of $80....
Suppose the demand for jackets is given by Qd = 120 – P, and the supply...
Suppose the demand for jackets is given by Qd = 120 – P, and the supply of jackets is given by Qs = -30 + 2P. Solve for the equilibrium price. Plug the equilibrium price back into the demand equation and solve for the equilibrium quantity. Double-check your work by plugging the equilibrium price into the supply equation and solving for the equilibrium quantity. Does your answer agree with what you got in (b)? Solve for the elasticity of demand...
Demand, Supply and Equilibrium: Given the following equations representing the behavior of producers and consumers: Price...
Demand, Supply and Equilibrium: Given the following equations representing the behavior of producers and consumers: Price Quantity Demanded Qd Quantity Supplied Qs 52 1,560 4,940 48 1,700 4,560 44 1,840 4,180 40 1,980 3,800 35 2,155 3,325 32 2,260 3,040 29 2,365 2,755 26 2,470 2,470 24 2,540 2,280 Consumers: Qd = 3,380 - 35P, Producers: Qs =95P, (P:...
Suppose the demand for towels is given by QD=100-5 P, and the supply of towels is given by Qs=10 P
Suppose the demand for towels is given by QD=100-5 P, and the supply of towels is given by Qs=10 Pa. Derive and graph the inverse supply and inverse demand curves.b. Solve for the equilibrium price and quantity.c. Suppose that supply changes so that at each price, 20 fewer towels are offered for sale. Derive and graph the new inverse supply curve.d. Solve for the new equilibrium price and quantity.
 Consider a perfectly competitive market where Demand is described as Qd 100-2P. a. If the market price is 10, how many units are consumed in the market? What is the consumer surplus in the market? b. Suppose the market Supply is described as Qs 10 P. What is the equilibrium price in the market? Quantity? C. Suppose the market Supply is described as Qs 10+ P. What is the excess quantity supplied in the market at P demanded in the...
 A market is described by the following supply and demand curves: Qs = 3P Qd = 400-P The equilibrium price is S and the equilibrium quantity is Suppose the government imposes a price ceiling of $80. This price ceiling is , and the market price will be supplied will be . and the quantity demanded will be . Therefore, a price calling of $60 will result in the quantity the quantity Suppose the government imposes a price floor of $80....
Most questions answered within 3 hours.
-
IN PYTHON ONLY !! Program 2: Re-work
program #5 (WeeklyHours) from the previous assignment such that...
asked 19 minutes ago -
The average length of time between arrivals at a turnpike
toll-booth is 26 seconds. What is...
asked 1 hour ago -
(a) A piston at 6.1 atm contains a gas that occupies a volume of
3.5 L....
asked 3 hours ago -
Please answer true or false. Words
cannot be changed or added in to make it true...
asked 3 hours ago -
An empty test tube weighs 15.923 grams. Then,
MgCl2•6H2O is added into the test tube. After...
asked 3 hours ago -
Assume memory access is 10 units of time and disk access is
10000 units of time....
asked 3 hours ago -
1. Are all good samples random?
2. Magazines often report surveys giving statistics such as “63%...
asked 3 hours ago -
Under all the various types of market structures, firms
must eventually earn some economic profits for...
asked 3 hours ago -
Consider the following fitness regime for a single locus trait
with two co-dominant alleles: w11 =...
asked 3 hours ago -
A large cable company reports the following.
80% of its customers subscribe to its cable TV...
asked 3 hours ago -
Please answer the question in brief.
Discuss the role of ERP in organizations. Are ERP tools...
asked 3 hours ago -
Discuss the pros and cons of collaborative software such
as SameTime. Does it increase productivity? What...
asked 3 hours ago