Based on historical data, daily demand of a product is normally
distributed with a mean of 200 and standard deviation of 50.
Develop a spreadsheet simulation model by simulating 300
observations of demand. After simulation freeze the simulated
demand values. Use Analysis ToolPak ? Histogram create a histogram
visualizing the demand distribution using bins: 100, 125, 150,
175,...,300. Use Analysis ToolPak ? Descriptive Statistics to
compute the descriptive statistics metrics of the simulated values.
Interpret skewness of the simulated demand. 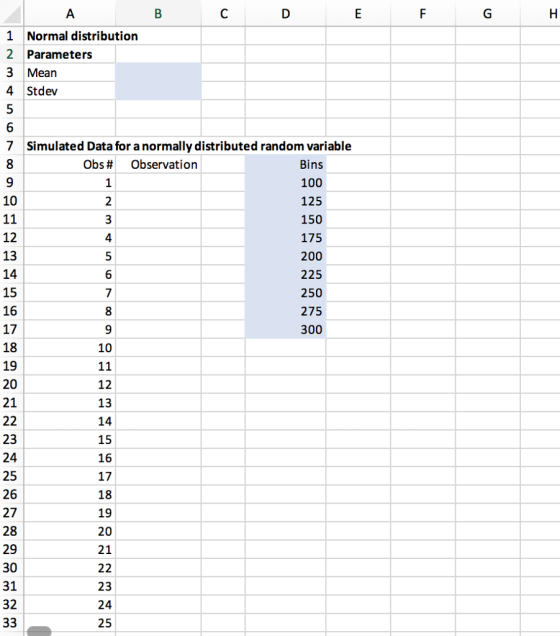
Homework Answers
| Obs # | Observation |
| 1 | 182.1499728 |
| 2 | 173.7575536 |
| 3 | 222.9312036 |
| 4 | 184.6198762 |
| 5 | 97.30167727 |
| 6 | 214.0221346 |
| 7 | 203.5851144 |
| 8 | 202.7227998 |
| 9 | 180.9708697 |
| 10 | 238.0489951 |
| 11 | 162.5512146 |
| 12 | 240.4168077 |
| 13 | 211.1750751 |
| 14 | 204.1299018 |
| 15 | 237.3273679 |
| 16 | 127.3647973 |
| 17 | 264.0836788 |
| 18 | 183.6060738 |
| 19 | 154.3243803 |
| 20 | 179.9883881 |
| 21 | 241.3788257 |
| 22 | 288.6111593 |
| 23 | 180.7362201 |
| 24 | 224.5582328 |
| 25 | 155.2683221 |
| 26 | 211.9804895 |
| 27 | 252.7270458 |
| 28 | 205.9945933 |
| 29 | 234.0023121 |
| 30 | 223.8872531 |
| 31 | 207.8522362 |
| 32 | 198.0622079 |
| 33 | 241.6649755 |
| 34 | 252.5939186 |
| 35 | 199.8144631 |
| 36 | 163.1761511 |
| 37 | 161.0454893 |
| 38 | 219.1814138 |
| 39 | 249.9726411 |
| 40 | 175.3683824 |
| 41 | 234.485879 |
| 42 | 186.5577252 |
| 43 | 196.6756263 |
| 44 | 97.83191268 |
| 45 | 156.5715143 |
| 46 | 162.8744263 |
| 47 | 311.8633008 |
| 48 | 109.2092366 |
| 49 | 219.0743776 |
| 50 | 255.5877477 |
| 51 | 206.2103709 |
| 52 | 192.2329721 |
| 53 | 214.7277319 |
| 54 | 132.7640126 |
| 55 | 204.3256705 |
| 56 | 193.616143 |
| 57 | 268.1541223 |
| 58 | 202.4048745 |
| 59 | 178.365679 |
| 60 | 215.5446287 |
| 61 | 158.3999397 |
| 62 | 226.1371156 |
| 63 | 164.1721615 |
| 64 | 244.0960548 |
| 65 | 161.6848072 |
| 66 | 85.13991411 |
| 67 | 245.0694415 |
| 68 | 222.5875851 |
| 69 | 187.2899821 |
| 70 | 194.7136757 |
| 71 | 223.7929498 |
| 72 | 365.7608664 |
| 73 | 56.44171829 |
| 74 | 253.0617399 |
| 75 | 120.631808 |
| 76 | 217.1992838 |
| 77 | 195.8240551 |
| 78 | 193.4580046 |
| 79 | 108.463451 |
| 80 | 173.9943632 |
| 81 | 131.3583885 |
| 82 | 198.5367367 |
| 83 | 295.2795745 |
| 84 | 128.8381787 |
| 85 | 224.0331133 |
| 86 | 244.9718982 |
| 87 | 260.1139618 |
| 88 | 246.1537866 |
| 89 | 196.4647373 |
| 90 | 284.842668 |
| 91 | 169.497253 |
| 92 | 178.6215881 |
| 93 | 224.3168188 |
| 94 | 237.7024207 |
| 95 | 167.6282414 |
| 96 | 202.4048745 |
| 97 | 163.0103957 |
| 98 | 163.19616 |
| 99 | 200.3041123 |
| 100 | 179.7727241 |
| 101 | 268.8976343 |
| 102 | 163.6361281 |
| 103 | 227.854071 |
| 104 | 255.0236336 |
| 105 | 201.3484396 |
| 106 | 150.2788341 |
| 107 | 163.1007768 |
| 108 | 140.5736162 |
| 109 | 159.1682354 |
| 110 | 118.5408797 |
| 111 | 209.6233066 |
| 112 | 143.1308879 |
| 113 | 225.7301735 |
| 114 | 100.4912752 |
| 115 | 178.7012257 |
| 116 | 251.3724672 |
| 117 | 199.2215862 |
| 118 | 269.1256901 |
| 119 | 177.4251478 |
| 120 | 171.9581183 |
| 121 | 221.7352181 |
| 122 | 230.4796686 |
| 123 | 192.4226017 |
| 124 | 215.6369993 |
| 125 | 217.9642257 |
| 126 | 251.5609599 |
| 127 | 121.7704953 |
| 128 | 208.3172722 |
| 129 | 157.8785719 |
| 130 | 216.4747007 |
| 131 | 195.0327947 |
| 132 | 237.9264975 |
| 133 | 187.1674845 |
| 134 | 178.0080771 |
| 135 | 139.9568651 |
| 136 | 211.335942 |
| 137 | 197.4151024 |
| 138 | 288.4097062 |
| 139 | 171.148668 |
| 140 | 253.9364464 |
| 141 | 198.8772856 |
| 142 | 121.31211 |
| 143 | 244.2712462 |
| 144 | 153.0081141 |
| 145 | 234.1035502 |
| 146 | 268.7201691 |
| 147 | 207.4072091 |
| 148 | 165.0467544 |
| 149 | 245.0349944 |
| 150 | 177.1367811 |
| 151 | 175.2301392 |
| 152 | 231.0296855 |
| 153 | 133.4195309 |
| 154 | 177.0645331 |
| 155 | 218.0866664 |
| 156 | 178.1259703 |
| 157 | 238.8974968 |
| 158 | 95.02248354 |
| 159 | 212.6112809 |
| 160 | 175.9539833 |
| 161 | 172.5247903 |
| 162 | 300.1262717 |
| 163 | 215.9586762 |
| 164 | 189.7602834 |
| 165 | 235.556468 |
| 166 | 167.4298579 |
| 167 | 214.4722776 |
| 168 | 168.65904 |
| 169 | 260.7171842 |
| 170 | 208.9306695 |
| 171 | 203.6349661 |
| 172 | 149.9895011 |
| 173 | 222.9949819 |
| 174 | 217.9887252 |
| 175 | 196.0505193 |
| 176 | 200.7630661 |
| 177 | 174.1169177 |
| 178 | 168.4866339 |
| 179 | 211.8349135 |
| 180 | 220.5182005 |
| 181 | 227.0137548 |
| 182 | 142.5723445 |
| 183 | 246.5416861 |
| 184 | 193.7780331 |
| 185 | 139.3147618 |
| 186 | 258.0085953 |
| 187 | 227.4529839 |
| 188 | 159.5195277 |
| 189 | 138.6949412 |
| 190 | 204.2911097 |
| 191 | 183.9527618 |
| 192 | 204.5982915 |
| 193 | 193.0874424 |
| 194 | 226.7353357 |
| 195 | 289.1495802 |
| 196 | 215.7454565 |
| 197 | 157.7038352 |
| 198 | 223.6474307 |
| 199 | 194.8944378 |
| 200 | 185.7589046 |
| 201 | 199.5773123 |
| 202 | 284.9072421 |
| 203 | 176.6345127 |
| 204 | 160.9936481 |
| 205 | 188.0431005 |
| 206 | 143.6824965 |
| 207 | 242.9563443 |
| 208 | 212.3942527 |
| 209 | 153.8051725 |
| 210 | 246.9799488 |
| 211 | 190.0023795 |
| 212 | 187.8107815 |
| 213 | 199.6462066 |
| 214 | 208.2901011 |
| 215 | 185.2762471 |
| 216 | 146.1388143 |
| 217 | 259.3797722 |
| 218 | 155.2397867 |
| 219 | 200.7669314 |
| 220 | 268.2509835 |
| 221 | 265.845029 |
| 222 | 243.1836042 |
| 223 | 188.2751922 |
| 224 | 188.1257509 |
| 225 | 185.0963945 |
| 226 | 261.8522336 |
| 227 | 196.2730044 |
| 228 | 219.0044602 |
| 229 | 155.4506758 |
| 230 | 190.6687549 |
| 231 | 191.6594788 |
| 232 | 253.9705525 |
| 233 | 251.5024112 |
| 234 | 231.8499929 |
| 235 | 109.7994987 |
| 236 | 147.3927801 |
| 237 | 212.283806 |
| 238 | 88.64510669 |
| 239 | 214.1375835 |
| 240 | 177.7508037 |
| 241 | 318.7827365 |
| 242 | 89.67192621 |
| 243 | 119.3662461 |
| 244 | 224.3426825 |
| 245 | 243.456339 |
| 246 | 115.6375452 |
| 247 | 111.7724201 |
| 248 | 266.7198492 |
| 249 | 178.6257945 |
| 250 | 226.1809419 |
| 251 | 273.7179562 |
| 252 | 79.47558111 |
| 253 | 230.8351105 |
| 254 | 187.1160981 |
| 255 | 167.0458237 |
| 256 | 200.7592575 |
| 257 | 213.6922722 |
| 258 | 171.3021452 |
| 259 | 153.5702955 |
| 260 | 220.1732746 |
| 261 | 197.6870413 |
| 262 | 196.0505193 |
| 263 | 252.0253707 |
| 264 | 316.0706233 |
| 265 | 168.8590151 |
| 266 | 157.6326672 |
| 267 | 131.9522885 |
| 268 | 287.9028903 |
| 269 | 194.2518798 |
| 270 | 274.6258593 |
| 271 | 159.5726194 |
| 272 | 305.2567313 |
| 273 | 145.1931672 |
| 274 | 262.6995416 |
| 275 | 204.4830699 |
| 276 | 216.0713398 |
| 277 | 204.3256705 |
| 278 | 141.7734671 |
| 279 | 183.0440061 |
| 280 | 168.9239303 |
| 281 | 154.7292191 |
| 282 | 203.4854111 |
| 283 | 266.0093065 |
| 284 | 287.7776074 |
| 285 | 191.0343718 |
| 286 | 107.2515493 |
| 287 | 68.02140484 |
| 288 | 246.7130121 |
| 289 | 187.9328811 |
| 290 | 169.878786 |
| 291 | 146.2685309 |
| 292 | 229.1364586 |
| 293 | 141.8487278 |
| 294 | 279.6526365 |
| 295 | 207.0091346 |
| 296 | 199.1527488 |
| 297 | 253.1424575 |
| 298 | 169.736507 |
| 299 | 269.016437 |
| 300 | 210.4194555 |
| Bin | Frequency |
| 100 | 9 |
| 125 | 12 |
| 150 | 20 |
| 175 | 46 |
| 200 | 66 |
| 225 | 65 |
| 250 | 37 |
| 275 | 30 |
| 300 | 9 |
| More | 6 |

| Column1 | |
| Mean | 199.1750669 |
| Standard Error | 2.794672672 |
| Median | 199.3994493 |
| Mode | 204.3256705 |
| Standard Deviation | 48.40515058 |
| Sample Variance | 2343.058603 |
| Kurtosis | 0.335615843 |
| Skewness | -0.034883434 |
| Range | 309.3191481 |
| Minimum | 56.44171829 |
| Maximum | 365.7608664 |
| Sum | 59752.52007 |
| Count | 300 |
| Largest(1) | 365.7608664 |
| Smallest(1) | 56.44171829 |
Since Skewness=-0.034883434 which is almost zero. Hence the simulated demand is symmetric.
Add Answer to:
Based on historical data, daily demand of a product is normally
distributed with a mean of...
Based on historical data, daily demand for a product takes values 20, 40 or 65 and follows a disc...
Based on historical data, daily demand for a product takes values 20, 40 or 65 and follows a discrete probability distribution as follows: p(20)= 0.25, p(40)= 0.6, p(65)= 0.15. Simulate 500 observations from this discrete distribution using RAND() and VLOOKUP(). Use Analysis ToolPak--Histogram create a histogram visualizing the sales distribution using appropriately selected bins. Interpret the histogram.
Month Period Gas Usage 40544 1 202 40575 2 204 40603 3 198 40634 4 102...
Month Period Gas Usage 40544 1 202 40575 2 204 40603 3 198 40634 4 102 40664 5 58 40695 6 20 40725 7 18 40756 8 16 40787 9 18 40817 10 58 40848 11 154 40878 12 192 40909 13 206 40940 14 220 40969 15 202 41000 16 98 41030 17 48 41061 18 21 41091 19 17 41122 20 15 41153 21 38 41183 22 62 41214 23 198 41244 24 240 41275 25 247 41306...
DATA: Compatible Mate Incompatible Mate 13 22 13 19 11 64 7 48 7 20 9...
 DATA:
Compatible Mate
Incompatible Mate
13
22
13
19
11
64
7
48
7
20
9
90
19
48
11
38
7
33
9
79
13
43
1
30
9
38
23
28
7
22
11
22
7
17
7
24
5
20
13
20
13
17
9
18
5
17
19
28
7
20
13
43
1
48
15
30
15
17
9
12
7
48
5
15
25
12
1
38
7
28
19
53
7
28
29...
DATA:
Compatible Mate
Incompatible Mate
13
22
13
19
11
64
7
48
7
20
9
90
19
48
11
38
7
33
9
79
13
43
1
30
9
38
23
28
7
22
11
22
7
17
7
24
5
20
13
20
13
17
9
18
5
17
19
28
7
20
13
43
1
48
15
30
15
17
9
12
7
48
5
15
25
12
1
38
7
28
19
53
7
28
29...
Download the attached data file. Use the data file to answer the questions 1 to 5...
 Download the attached data file. Use the data file to answer the questions 1 to 5 1. Select a proper variable and use a bar graph to describe the distributions of this variable (show percentage, increasingly) a. Use a paragraph to describe the frequency distribution and relative frequency of this variable. Indicate the mode 2. Construct two pie charts by using another proper variable by further dividing this variable into two categories with another two-leveled variable a. Also, use a...
Jennifer Nguyen, a Humber College Healthcare Management program graduate insurance who always had only perfect marks...
 Jennifer Nguyen, a Humber College Healthcare Management program graduate insurance who always had only perfect marks in statistics, was hired by the famous Healthy Life medical insurance company. Jennifer is assigned to conduct statistical analysis of medical and financial data. As Jennifer is on probation, please help her to complete the following six tasks. In problems 2-6, state hypotheses Ho and H and provide detailed conclusions (based on P-values or critical values/test statistics) together with the Excel output. For your...
What is the conclusion for t-test concerning if the mean child mortality rate for countries in...
 What is the conclusion for t-test concerning if the mean child
mortality rate for countries in Africa is more than the mean child
mortality rate for countries in South Asia?
Did i get the right answer?
1.
RYAN GREGURICH of 5 Step 1 of 1 Question 2- 00:16:35 What is the conclusion for t-test concerning if the mean child mortality rate for countrles in Afica is more than the mean child mortality rate for countries in South Asia? Answer 10...
What is the conclusion for t-test concerning if the mean child
mortality rate for countries in Africa is more than the mean child
mortality rate for countries in South Asia?
Did i get the right answer?
1.
RYAN GREGURICH of 5 Step 1 of 1 Question 2- 00:16:35 What is the conclusion for t-test concerning if the mean child mortality rate for countrles in Afica is more than the mean child mortality rate for countries in South Asia? Answer 10...
Assigned Media Question Help Assume that thermometer readings are normally distributed with a mean of 0°C...
 Assigned Media Question Help Assume that thermometer readings are normally distributed with a mean of 0°C and a standard deviaton of 1 00.С. Athem meter is draw a sketch, and find the probability of the reading (The given values are in Celsius degrees.) randomy selected and tested. For the case below Between 1.50 and 2.25 Draw a sketch. Choose the correct graph below B. Ос. 150 2.25 9.502 225 50 2225 Glick to select your answer and then click Check...
STA2221 examples on CI & Testing of Hypothesis Name MULTIPLE CHOICE. Choose the one alternative that...
 STA2221 examples on CI & Testing of Hypothesis Name MULTIPLE CHOICE. Choose the one alternative that best completes the statement or answer the question Provide an appropriate response. 1) Find the critical value,te for 0.99 and n-10. A) 3.250 B) 3.169 1.833 D) 2.262 2) Find the critical value to forc=0.95 and n=16. A) 2.947 B) 2.602 2120 D) 2.131 3) Find the value of E, the margin of error, for A) 1.69 B) 0.42 0.99, n=16 and s=2.6. C)...
Row and Flow is a sports brand that specializes in rowing gear and apparel. They are...
 Row and Flow is a sports brand that specializes in rowing gear
and apparel. They are currently selling two boats:
The King is a high end boat, very high quality and also quite
expensive. This boat is a slow moving item, and its monthly demand
is estimated to follow a poisson distribution with a lambda of
1.
Speedy is a medium quality, more affordable boat. In any given
month, the total number of orders for Speedys is uniformly
distributed between...
Row and Flow is a sports brand that specializes in rowing gear
and apparel. They are currently selling two boats:
The King is a high end boat, very high quality and also quite
expensive. This boat is a slow moving item, and its monthly demand
is estimated to follow a poisson distribution with a lambda of
1.
Speedy is a medium quality, more affordable boat. In any given
month, the total number of orders for Speedys is uniformly
distributed between...
 DATA:
Compatible Mate
Incompatible Mate
13
22
13
19
11
64
7
48
7
20
9
90
19
48
11
38
7
33
9
79
13
43
1
30
9
38
23
28
7
22
11
22
7
17
7
24
5
20
13
20
13
17
9
18
5
17
19
28
7
20
13
43
1
48
15
30
15
17
9
12
7
48
5
15
25
12
1
38
7
28
19
53
7
28
29...
DATA:
Compatible Mate
Incompatible Mate
13
22
13
19
11
64
7
48
7
20
9
90
19
48
11
38
7
33
9
79
13
43
1
30
9
38
23
28
7
22
11
22
7
17
7
24
5
20
13
20
13
17
9
18
5
17
19
28
7
20
13
43
1
48
15
30
15
17
9
12
7
48
5
15
25
12
1
38
7
28
19
53
7
28
29...
 Download the attached data file. Use the data file to answer the questions 1 to 5 1. Select a proper variable and use a bar graph to describe the distributions of this variable (show percentage, increasingly) a. Use a paragraph to describe the frequency distribution and relative frequency of this variable. Indicate the mode 2. Construct two pie charts by using another proper variable by further dividing this variable into two categories with another two-leveled variable a. Also, use a...
 Download the attached data file. Use the data file to answer the questions 1 to 5 1. Select a proper variable and use a bar graph to describe the distributions of this variable (show percentage, increasingly) a. Use a paragraph to describe the frequency distribution and relative frequency of this variable. Indicate the mode 2. Construct two pie charts by using another proper variable by further dividing this variable into two categories with another two-leveled variable a. Also, use a...
 Jennifer Nguyen, a Humber College Healthcare Management program graduate insurance who always had only perfect marks in statistics, was hired by the famous Healthy Life medical insurance company. Jennifer is assigned to conduct statistical analysis of medical and financial data. As Jennifer is on probation, please help her to complete the following six tasks. In problems 2-6, state hypotheses Ho and H and provide detailed conclusions (based on P-values or critical values/test statistics) together with the Excel output. For your...
 What is the conclusion for t-test concerning if the mean child
mortality rate for countries in Africa is more than the mean child
mortality rate for countries in South Asia?
Did i get the right answer?
1.
RYAN GREGURICH of 5 Step 1 of 1 Question 2- 00:16:35 What is the conclusion for t-test concerning if the mean child mortality rate for countrles in Afica is more than the mean child mortality rate for countries in South Asia? Answer 10...
What is the conclusion for t-test concerning if the mean child
mortality rate for countries in Africa is more than the mean child
mortality rate for countries in South Asia?
Did i get the right answer?
1.
RYAN GREGURICH of 5 Step 1 of 1 Question 2- 00:16:35 What is the conclusion for t-test concerning if the mean child mortality rate for countrles in Afica is more than the mean child mortality rate for countries in South Asia? Answer 10...
 Assigned Media Question Help Assume that thermometer readings are normally distributed with a mean of 0°C and a standard deviaton of 1 00.С. Athem meter is draw a sketch, and find the probability of the reading (The given values are in Celsius degrees.) randomy selected and tested. For the case below Between 1.50 and 2.25 Draw a sketch. Choose the correct graph below B. Ос. 150 2.25 9.502 225 50 2225 Glick to select your answer and then click Check...
 STA2221 examples on CI & Testing of Hypothesis Name MULTIPLE CHOICE. Choose the one alternative that best completes the statement or answer the question Provide an appropriate response. 1) Find the critical value,te for 0.99 and n-10. A) 3.250 B) 3.169 1.833 D) 2.262 2) Find the critical value to forc=0.95 and n=16. A) 2.947 B) 2.602 2120 D) 2.131 3) Find the value of E, the margin of error, for A) 1.69 B) 0.42 0.99, n=16 and s=2.6. C)...
 Row and Flow is a sports brand that specializes in rowing gear
and apparel. They are currently selling two boats:
The King is a high end boat, very high quality and also quite
expensive. This boat is a slow moving item, and its monthly demand
is estimated to follow a poisson distribution with a lambda of
1.
Speedy is a medium quality, more affordable boat. In any given
month, the total number of orders for Speedys is uniformly
distributed between...
Row and Flow is a sports brand that specializes in rowing gear
and apparel. They are currently selling two boats:
The King is a high end boat, very high quality and also quite
expensive. This boat is a slow moving item, and its monthly demand
is estimated to follow a poisson distribution with a lambda of
1.
Speedy is a medium quality, more affordable boat. In any given
month, the total number of orders for Speedys is uniformly
distributed between...
Most questions answered within 3 hours.
-
Calculate the equillibrium constent K for a redox reaction that
has E°cell = -.98 V at...
asked 11 minutes ago -
A concave spherical mirror has a radius of curvature of
magnitude 19.6 cm.
(a) Find the...
asked 12 minutes ago -
3. draw a diagram of the magnetic field:
a. around a long straight wire with a...
asked 11 minutes ago -
If you titrated 30.0 mL of 0.1 M HCl with 0.1 M NaOH, indicate
the approximate...
asked 20 minutes ago -
NADH passes electrons into the electron transport chain. List
the carriers that would receive the electrons,...
asked 28 minutes ago -
A cylindrical cable with a resistivity of 1.6x10⁻⁸ Ω·m and cross
sectional area of 3x10⁻⁵ m^2...
asked 28 minutes ago -
True or False.
A consumer with convex preferences who is indifferent between
the bundles (5,2) and...
asked 31 minutes ago -
A diamond's index of refraction for red light, 656 nm, is 2.410,
while that for blue...
asked 44 minutes ago -
Compare HPLC, SPE, and GC. Identify the differences, the
advantages, and the weaknesses of each method.
asked 46 minutes ago -
Characteristic x-rays emitted by potassium have a wavelength of
0.374 nm. What is the energy of...
asked 48 minutes ago -
there is a function to create two random numbers between 1 and
25 and a function...
asked 1 hour ago -
At a certain temperature, the ?pKp for the decomposition of
H2SH2S is 0.832.0.832.
H2S(g)↽−−⇀H2(g)+S(g)H2S(g)↽−−⇀H2(g)+S(g)
Initially, only...
asked 1 hour ago