28-32. A manufacturer of an air compressor and tire pump wants to test two possible point-of-purchase...
-
28-32. A manufacturer of an air compressor and tire pump wants to test two possible point-of-purchase displays. The product is sold through independent auto parts stores, which vary greatly in sales volume. A total of 30 stores agree to feature the display for one month. The stores are matched on the basis of annual sales volume. One of the two largest stores is randomly chosen to receive display A; the other receives B. The same thing is done for the third and fourth largest stores, and so on down to the two smallest. Sales for the 1-month period are recorded in the table below. Do the data indicate that display A yields to a higher sales level than display B? Use α= .01 .
Display A
Display B
46
37
39
42
40
37
37
38
32
27
26
19
21
20
23
17
20
20
17
12
13
12
15
9
11
7
8
2
9
6
Descriptive statistics for two-sample test
Variable
N
Mean
StDev
Display A
15
23.80
12.33
Display B
15
20.33
13.04
Descriptive statistics for paired test
Variable
N
Mean
StDev
Display A - Display B
15
3.467
3.314
28. The following test should be used.
two-sample test
paired test
z-test about a mean
t-test about a mean
3.125 points
QUESTION 29
-
29. Set up the appropriate hypotheses for this test.
H0 : μ1=μ2 versus Ha : μ1<μ2
H0 : μ1=μ2 versus Ha : μ1>μ2
H0 : μ1=μ2 versus Ha : μ1≠μ2
H0 : μd=0 versus Ha : μd>0
H0 : μd=0 versus Ha : μd<0
3.125 points
QUESTION 30
-
30. What is the value of test statistic? Round your answers to three decimal places.
2.668
-.749
.749
4.052
-4.052
3.125 points
QUESTION 31
-
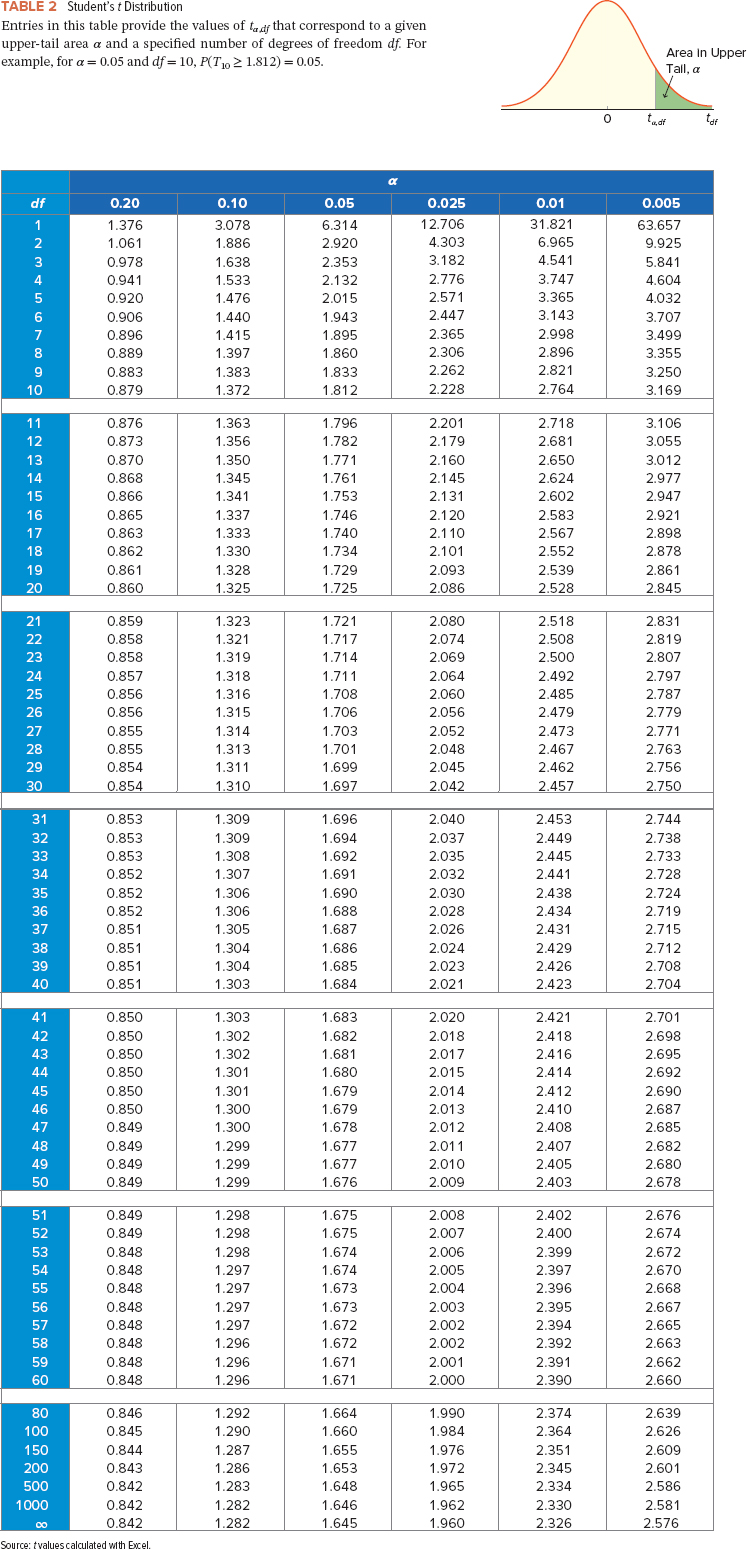
31. What is the rejection region?
[2.624, +∞]
[2.326, +∞]
[-∞, -2.624]
[-∞, -2.977] U[2.977, +∞]
[-∞, -2.576] U[2.576, +∞]
3.125 points
QUESTION 32
-
32. What is your conclusion?
Accept Ha, display A yields to a higher sales level than display B
Reject Ha, display A does not yields to a higher sales level than display B
Accept Ha, display A yields to a lower sales level than display B
Reject Ha, display A yields to a lower sales level than display B
Accept Ha, there is no difference in yields between two displays
Homework Answers
Request Answer!
We need at least 10 more requests to produce the answer.
0 / 10 have requested this problem solution
The more requests, the faster the answer.
Add Answer to:
28-32. A manufacturer of an air compressor and
tire pump wants to test two possible point-of-purchase...
HyVee is redesigning the check out lanes in it's supermarkets and is considering two designs. Tests...
HyVee is redesigning the check out lanes in it's supermarkets and is considering two designs. Tests on customer checkout times conducted at two stores -- the older stores in Iowa versus the new stores in Illinois -- resulted in the following data: Use Table 1. (Note: the automated question following this one will ask you confidence interval questions for this same data, so jot down your work.) Old Iowa stores New Illinois stores x−1x−1 = 4.1 minutes x−2x−2 = 3.4...
Assume that the assumptions and conditions for inference with a two-sample t-test are met. Test the...
Assume that the assumptions and conditions for inference with a two-sample t-test are met. Test the indicated claim about the means of the two populations. State your conclusion.A researcher wishes to determine whether people with high blood pressure can reduce their blood pressure by following a particular diet. Use the sample data below to test the claim that the treatment population mean μ1 is smaller than the control population mean μ2. Test the claim using a significance level of 0.01. Treatment...
A phone manufacturer wants to compete in the touch screen phone market. Management understands that the...
A phone manufacturer wants to compete in the touch screen phone market. Management understands that the leading product has a less than desirable battery life. They aim to compete with a new touch screen phone that is guaranteed to have a battery life more than two hours longer than the leading product. A recent sample of 123 units of the leading product provides a mean battery life of 5 hours and 50 minutes with a standard deviation of 41 minutes....
In a pilot study for testing the "truth" to the theory that, on average, U.S. adults...
In a pilot study for testing the "truth" to the theory that, on average, U.S. adults gain weight between Thanksgiving and January, a research team looked at responses from 8 randomly selected U.S. adults. The subjects were weighed (lb) on the day before Thanksgiving and again on January 3rd The raw data are found in Table 1. Let α = 0.05 Table 1: Weights (lb) before Thanksgiving and on Jan. 3rd for 8 U.S. adults Pre-Thanksgiving 146.1 157.7 150.7 152.5...
You may need to use the appropriate technology to answer this question. Researchers at two universities found that airlines are doing a better job of getting passengers to their destinations on time....
You may need to use the appropriate technology to answer this question. Researchers at two universities found that airlines are doing a better job of getting passengers to their destinations on time. Company A and Company B Airlines were among the leaders in on-time arrivals with both having 88% of their flights arriving on time. But for the 12% of flights that were delayed, how many minutes were these flights late? Sample data showing the number of minutes that delayed...
A phone manufacturer wants to compete in the touch screen phone market. Management understands that the leading product has a less than desirable battery life. They aim to compete with a new touch screen phone that is guaranteed to have a battery life mor
 A phone manufacturer wants to compete in the touch screen phone market. Management understands that the leading product has a less than desirable battery life. They aim to compete with a new touch screen phone that is guaranteed to have a battery life more than two hours longer than the leading product. A recent sample of 120 units of the leading product provides a mean battery life of 5 hours and 40 minutes with a standard deviation of 30 minutes. A...
a) State the null and alternative hypotheses. Which of the following is correct? A. H0: μ1=μ2;...
 a) State the null and alternative hypotheses. Which of the
following is correct?
A. H0: μ1=μ2; Ha: μ1<μ2 This is the correct answer.
B. H0: μ1=μ2; Ha: μ1≠μ2
C. H0: μ1=μ2; Ha: μ1>μ2
(b) Identify the P-value and state the researcher's
conclusion if the level of significance was
α=_____
What is the P-value?
P-value=____
State the researcher's conclusion. Which of the following is
correct?
A. Fail to reject H0,there is sufficient evidence to conclude
that the mean step pulse of...
a) State the null and alternative hypotheses. Which of the
following is correct?
A. H0: μ1=μ2; Ha: μ1<μ2 This is the correct answer.
B. H0: μ1=μ2; Ha: μ1≠μ2
C. H0: μ1=μ2; Ha: μ1>μ2
(b) Identify the P-value and state the researcher's
conclusion if the level of significance was
α=_____
What is the P-value?
P-value=____
State the researcher's conclusion. Which of the following is
correct?
A. Fail to reject H0,there is sufficient evidence to conclude
that the mean step pulse of...
Suppose μ1 and μ2 are true mean stopping distances at 50 mph for cars of a...
Suppose μ1 and μ2 are true mean stopping distances at 50 mph for cars of a certain type equipped with two different types of braking systems. Use the two-sample t test at significance level 0.01 to test H0: μ1 − μ2 = −10 versus Ha: μ1 − μ2 < −10 for the following data: m = 7, x = 114.6, s1 = 5.03, n = 7, y = 129.4, and s2 = 5.35. Calculate the test statistic and determine the...
To test whether the mean time needed to mix a batch of material is the same for machines produced by three manufacturers...
 To test whether the mean time needed to mix a batch of material
is the same for machines produced by three manufacturers, a
chemical company obtained the following data on the time (in
minutes) needed to mix the material.
Manufacturer
1
2
3
20
28
20
25
25
18
24
32
24
27
27
18
(a)
Use these data to test whether the population mean times for
mixing a batch of material differ for the three manufacturers.
Use
α =...
To test whether the mean time needed to mix a batch of material
is the same for machines produced by three manufacturers, a
chemical company obtained the following data on the time (in
minutes) needed to mix the material.
Manufacturer
1
2
3
20
28
20
25
25
18
24
32
24
27
27
18
(a)
Use these data to test whether the population mean times for
mixing a batch of material differ for the three manufacturers.
Use
α =...
Do students perform worse when they take a test alone than when they take an test...
Do students perform worse when they take a test alone than when they take an test in a classroom setting? Eight students were given two tests of equal difficulty. They took one test in a solitary room and they took the other in a room filled with other students. The results are shown below. test Scores Alone 70 79 74 80 76 86 67 85 Classroom 74 79 90 82 81 97 70 84 Copy to Clipboard Assume a Normal...
 a) State the null and alternative hypotheses. Which of the
following is correct?
A. H0: μ1=μ2; Ha: μ1<μ2 This is the correct answer.
B. H0: μ1=μ2; Ha: μ1≠μ2
C. H0: μ1=μ2; Ha: μ1>μ2
(b) Identify the P-value and state the researcher's
conclusion if the level of significance was
α=_____
What is the P-value?
P-value=____
State the researcher's conclusion. Which of the following is
correct?
A. Fail to reject H0,there is sufficient evidence to conclude
that the mean step pulse of...
a) State the null and alternative hypotheses. Which of the
following is correct?
A. H0: μ1=μ2; Ha: μ1<μ2 This is the correct answer.
B. H0: μ1=μ2; Ha: μ1≠μ2
C. H0: μ1=μ2; Ha: μ1>μ2
(b) Identify the P-value and state the researcher's
conclusion if the level of significance was
α=_____
What is the P-value?
P-value=____
State the researcher's conclusion. Which of the following is
correct?
A. Fail to reject H0,there is sufficient evidence to conclude
that the mean step pulse of...
 To test whether the mean time needed to mix a batch of material
is the same for machines produced by three manufacturers, a
chemical company obtained the following data on the time (in
minutes) needed to mix the material.
Manufacturer
1
2
3
20
28
20
25
25
18
24
32
24
27
27
18
(a)
Use these data to test whether the population mean times for
mixing a batch of material differ for the three manufacturers.
Use
α =...
To test whether the mean time needed to mix a batch of material
is the same for machines produced by three manufacturers, a
chemical company obtained the following data on the time (in
minutes) needed to mix the material.
Manufacturer
1
2
3
20
28
20
25
25
18
24
32
24
27
27
18
(a)
Use these data to test whether the population mean times for
mixing a batch of material differ for the three manufacturers.
Use
α =...
Most questions answered within 3 hours.
-
You capture data by having 8 people fill in 30 small dots on a
piece of...
asked 3 hours ago -
What are the z-values such that 70% of the area lies in the
middle of the...
asked 5 hours ago -
You borrow $29,500 to purchase a brand new car. The interest
rate is 6%, and the...
asked 5 hours ago -
The amount of time it takes an asteroid, whose average distance
from the Sun is 4.70...
asked 5 hours ago -
A 0.289 kg mass slides on a frictionless floor with a speed of
1.34 m/s. The...
asked 5 hours ago -
15.A box contains five red balls, three green balls, and two
yellow balls. Suppose you select...
asked 8 hours ago -
Assume you are given the following for Stackelberg industries:
Return on Assets (ROA) = 8%
Debt...
asked 6 hours ago -
an engineer proposes to use mmWave in 5G network to
increase data rate.
What are the...
asked 6 hours ago -
Explain the idea behind using SEMIJOIN in distributed
query processing.
asked 6 hours ago -
why
is context important in selecting and applying guidelines and
principles for interface design?
illustrate your...
asked 6 hours ago -
In a certain board game, a player rolls two fair six-sided dice
until the player rolls...
asked 8 hours ago -
You are going to deposit $3,200 in an account that pays .58
percent interest compounded quarterly....
asked 6 hours ago