
Homework Answers
4 a)
Here we have to test that


n = 150
x = 128

Test statistic:
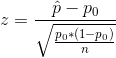

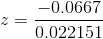
z = -3.01 (Round to 2 decimal)
Test statistic = -3.01
alpha = 0.01
Test is one tailed (left tailed) test.
Critical value for alpha = 0.01 is
z critical = -2.33 (From statistical table of z values, value corresponding to 0.0099)
Here test statistic < z critical
So we reject H0.
Conclusion: There sufficient evidence to conclude that population proportion who experience the symptom is less than 0.92
b) Test is one tailed (left tailed) test.
P value = P(z < -3.01)
= 0.0013 (From statistical table of z values)
P value = 0.0013
Interpretation of p value:
Here p value indicates strong evidence against null hypothesis.
Add Answer to:
LHhal Exam Name:_ in a sample of 150 hospital emergency admissions with a certain diagnosis, 128...
Consider the following hypotheses: Ho: 4 = 150 HA: H < 150 A sample of 80...
 Consider the following hypotheses: Ho: 4 = 150 HA: H < 150 A sample of 80 observations results in a sample mean of 144. The population standard deviation is known to be 28. (You may find it useful to reference the appropriate table: z table or t table) a-1. Calculate the value of the test statistic. (Negative value should be indicated by a minus sign. Round intermediate calculations to at least 4 decimal places and final answer to 2 decimal...
--------A sample of 36 observations is selected from a normal population. The sample mean is 34,...
--------A sample of 36 observations is selected from a normal population. The sample mean is 34, and the population standard deviation is 5. Carry out a hypothesis test (with a level of significance α of 0.05) of the null hypothesis H0: µ ≥ 35 using the 6-step procedure ---------Suppose that someone claims that the mean number of sick days taken by U.S. employees is 5.1. You decide to investigate that claim and take a representative sample of 87 U.S. employees...
1. ANOVA is a statistical method for verifying the equality between some sample means b. a....
 1. ANOVA is a statistical method for verifying the equality between some sample means b. a. some sample standard deviations c. some population standard deviations d some population means Salary information regarding male and female employees of a large company is shown below Sample Size Male (Pop. 1) Female (Pop. 2) 49 47 Sample Mean Salary (in $1,000) , Population Variance 2. The point estimate of the difference μ-μ, between the two population means is Y 7-44-3.0 3. The margin...
The following information was obtained from independent random samples. Assume normally populations with equal Sample 1...
 The following information was obtained from independent random samples. Assume normally populations with equal Sample 1 Sample 2 12 Sample Size 10 Sample Mean 52 Sample Variance 85 We are interested in testing Hai sample 1 -Hsample 2 0 Step 2 of 3: Determine the p-value for the test. TablesKeypad Answer 1 Point Next Prev O p-value c 0.025 0.025< p-value <0.05 Op-value <0.1 。p-value > 0.2 None of the above o 2019 8 3 of 3 The following information...
A simple random sample of size n=40 is drawn from a population. The sample mean is...
A simple random sample of size n=40 is drawn from a population. The sample mean is found to be 106.9,and the sample standard deviation is found to be 15.1. Is the population mean greater than 100 at the α=0.025 level of significance? A) Determine the null and alternative hypotheses. B) Compute the test statistic C) Determine the P-value. (Round to three decimal places as needed.) D) What is the result of the hypothesis test? ____ the null hypothesis because the...
Please help with work shown!! Greatly appreciated! Question 2) In order for a spark plug to...
Please help with work shown!! Greatly appreciated! Question 2) In order for a spark plug to work optimally the spark plug mean gap should be exactly 0.25 inches. A company conducts a quality control check by selecting a simple random sample of 40 spark plugs with a sample mean of 0.254 inches and a sample standard deviation of 0.012 inches. ( assume the population of gap measurements is normally distributed) 2a) Does this sample provide sufficient evidence that the population...
Consider the following competing hypotheses and accompanying sample data drawn independently from normally distributed populations. (You...
 Consider the following competing hypotheses and accompanying sample data drawn independently from normally distributed populations. (You may find it useful to reference the appropriate table: z table or t table) Ho: H1-Hu2 0 HA: H1 Hz< e 251 252 s1 39 s=19 n1=7 n 7 a-1. Calculate the value of the test statistic under the assumption that the population variances are equal. (Negative values should be indicated by a minus sign. Round all intermediate calculations to at least 4 decimal...
A random sample of 49 measurements from a population with population standard deviation σ1 = 3...
A random sample of 49 measurements from a population with population standard deviation σ1 = 3 had a sample mean of x1 = 8. An independent random sample of 64 measurements from a second population with population standard deviation σ2 = 4 had a sample mean of x2 = 10. Test the claim that the population means are different. Use level of significance 0.01. 1. Compute x1 − x2 and x1 − x2 = 2. Compute the corresponding sample distribution...
A simple random sample of size n=15 is drawn from a population that is normally distributed....
A simple random sample of size n=15 is drawn from a population that is normally distributed. The sample means found to be x=26.7 and the sample standard deviation is found to be s=6.3.Determine if the population mean is different from 25 at the a=0.01 level of significance. A. Determine the null and alternative hypotheses. B. Calculate the p value. C. State the conclusion for the test. Choose from below: a. Do not reject h0 because the P-value is less than...
Two teaching methods and their effects on science test scores are being reviewed. A random sample...
 Two teaching methods and their effects on science test scores are being reviewed. A random sample of 14 students, taught in traditional lab sessions, had a mean test score of 78.9 with a standard deviation of 5.5. A random sample of 7 students, taught using interactive simulation software, had a mean test score of 84.5 with a standard deviation of 5.3. Do these results support the claim that the mean science test score is lower for students taught in traditional...
 Consider the following hypotheses: Ho: 4 = 150 HA: H < 150 A sample of 80 observations results in a sample mean of 144. The population standard deviation is known to be 28. (You may find it useful to reference the appropriate table: z table or t table) a-1. Calculate the value of the test statistic. (Negative value should be indicated by a minus sign. Round intermediate calculations to at least 4 decimal places and final answer to 2 decimal...
 1. ANOVA is a statistical method for verifying the equality between some sample means b. a. some sample standard deviations c. some population standard deviations d some population means Salary information regarding male and female employees of a large company is shown below Sample Size Male (Pop. 1) Female (Pop. 2) 49 47 Sample Mean Salary (in $1,000) , Population Variance 2. The point estimate of the difference μ-μ, between the two population means is Y 7-44-3.0 3. The margin...
 The following information was obtained from independent random samples. Assume normally populations with equal Sample 1 Sample 2 12 Sample Size 10 Sample Mean 52 Sample Variance 85 We are interested in testing Hai sample 1 -Hsample 2 0 Step 2 of 3: Determine the p-value for the test. TablesKeypad Answer 1 Point Next Prev O p-value c 0.025 0.025< p-value <0.05 Op-value <0.1 。p-value > 0.2 None of the above o 2019 8 3 of 3 The following information...
 Consider the following competing hypotheses and accompanying sample data drawn independently from normally distributed populations. (You may find it useful to reference the appropriate table: z table or t table) Ho: H1-Hu2 0 HA: H1 Hz< e 251 252 s1 39 s=19 n1=7 n 7 a-1. Calculate the value of the test statistic under the assumption that the population variances are equal. (Negative values should be indicated by a minus sign. Round all intermediate calculations to at least 4 decimal...
 Two teaching methods and their effects on science test scores are being reviewed. A random sample of 14 students, taught in traditional lab sessions, had a mean test score of 78.9 with a standard deviation of 5.5. A random sample of 7 students, taught using interactive simulation software, had a mean test score of 84.5 with a standard deviation of 5.3. Do these results support the claim that the mean science test score is lower for students taught in traditional...
Most questions answered within 3 hours.
-
A college student is employed as a door-to-door newspaper
salesman. Historical data suggests that the student...
asked 2 minutes ago -
Considering gravitational time dilation, calculate the time that
passes in Earth’s surface while 1 hour passes...
asked 26 minutes ago -
Minitab Problem: Take the Lake Hume June rainfall data and find
use the processes outlined in...
asked 1 hour ago -
X Company is trying to decide whether to continue using old
equipment to make Product A...
asked 1 hour ago -
IN PYTHON ONLY !! Program 2: Re-work
program #5 (WeeklyHours) from the previous assignment such that...
asked 1 hour ago -
The average length of time between arrivals at a turnpike
toll-booth is 26 seconds. What is...
asked 3 hours ago -
(a) A piston at 6.1 atm contains a gas that occupies a volume of
3.5 L....
asked 4 hours ago -
Please answer true or false. Words
cannot be changed or added in to make it true...
asked 4 hours ago -
An empty test tube weighs 15.923 grams. Then,
MgCl2•6H2O is added into the test tube. After...
asked 4 hours ago -
Assume memory access is 10 units of time and disk access is
10000 units of time....
asked 5 hours ago -
1. Are all good samples random?
2. Magazines often report surveys giving statistics such as “63%...
asked 5 hours ago -
Under all the various types of market structures, firms
must eventually earn some economic profits for...
asked 5 hours ago