![Consider a pair of independently modulated signals, ue(t) ΣΝ1b [n]p(t-n) and us(t) bnlp(t -n), where the symbols beln), b, nl are chosen with equal probability to be +1 and -1, and p(t) Io.1](t) is a rectangular pulse. Let N 100 (1.1) Use Matlab to plot a typical realization of ue(t) andu(t) over 10 symbols. Make sure you sample fast enough for the plot to look reasonably nice.](http://img.homeworklib.com/questions/9a2a72c0-d5eb-11ea-b8c9-5f1edf6b8dcb.png?x-oss-process=image/resize,w_560)
Homework Answers
Answer #1
ze=zeros(100,1);
for i=1:100
ze(i)=1-2*binornd(1,0.5);
end
c=ze;
T=4e-5;
t= linspace(-5*T,5*T,81);
h=ones(1,8);
u_c=conv(c,h,"same");
u_s=conv(c,h,"same");
so the plots are are the following
a)u_c

b)u_s
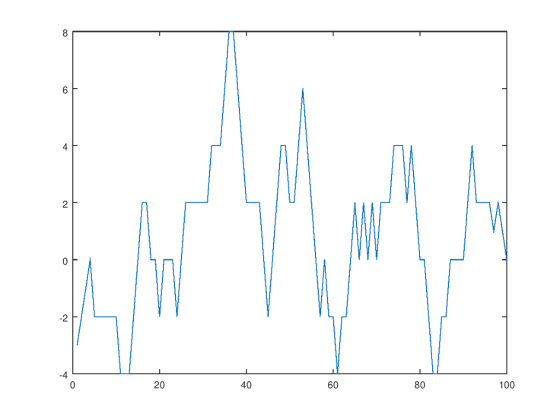
4 2 2 -4 40 60 80 100 20
We were unable to transcribe this image
Know the answer?
Add Answer to:
Consider a pair of independently modulated signals, ue(t) ΣΝ1b [n]p(t-n) and us(t) bnlp(t -n), where the...
Not the answer you're looking for?
Ask your own homework help question.
Our experts will answer your question WITHIN MINUTES for Free.
Similar Homework Help Questions
ADVERTISEMENT
Need Online Homework Help?
Ask
a QuestionGet Answers For Free
Most questions answered within 3 hours.
Most questions answered within 3 hours.
ADVERTISEMENT
ADVERTISEMENT
Active Questions
-
Angel Corporation has $10,000,000 of
8.0% 25 year bonds dated May 1, 2018 with interest payable...
asked 4 minutes ago -
7.
________ involves individuals trading goods they already have or
providing services in exchange for something...
asked 8 minutes ago -
Share your research problem. What databases did you search as
you gathered evidence to support your...
asked 8 minutes ago -
what process occurs to form microspores and megaspores in flowering
plants?
asked 16 minutes ago -
C++
I need to use the function getData to put in all my data using
arrays....
asked 15 minutes ago -
A block is hung by a string from the inside roof of a van. When
the...
asked 22 minutes ago -
Do you think companies should not go for long term debt in their
capital structure to...
asked 31 minutes ago -
I create an address book where the user enters the name, phone
and email in the...
asked 37 minutes ago -
The production capacity for acrylonitrile
(C3H3N) in the United States exceeds 2
million pounds per year....
asked 44 minutes ago -
explain and comment out your answer
43. How many address lines are required to address a...
asked 51 minutes ago -
A sample of 45 observations is selected from a normal
population. The sample mean is 49,...
asked 1 hour ago -
A construction company is planning to bid on a building
contract. The bid costs the company...
asked 1 hour ago
ADVERTISEMENT