
Homework Answers
Turn around time = Finish time - Arrival time .
Waiting Time= Turn around time - Burst time.
Finish time is determined from the chart .
For the question 1)
part A) FCFS :
In fcfs , the processes are executed in the order of their arrival. If the process enters into execution phase , it completes its execution .
the image attached shows the gantt chart and average turnaround time and average waiting time.
Please Note: the image contains average turnaround time and average waiting time.

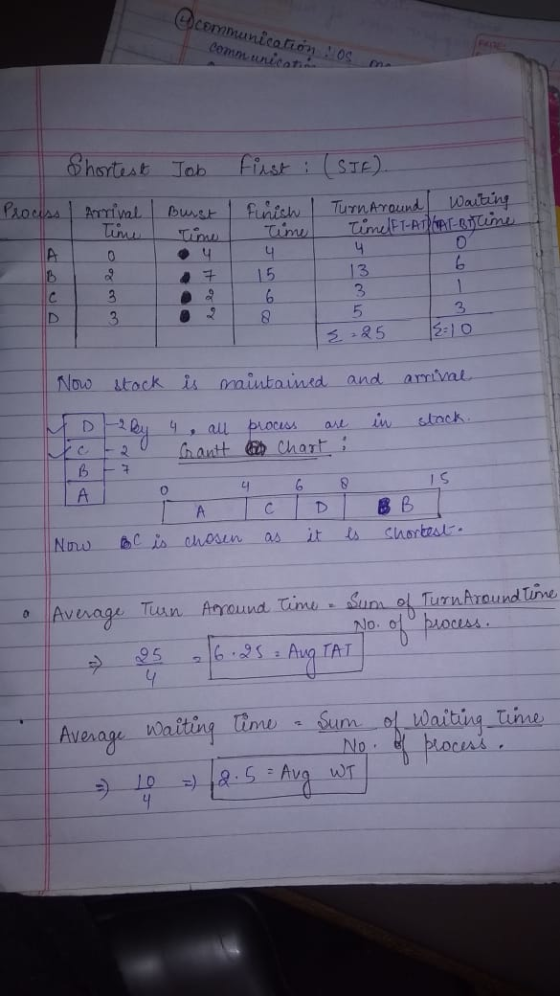
Part B) Shortest Job first.
Shortest job first can be considered as a non preemptive job scheduling as there is no context switching .
In this , the job with shortest burst time is served first and completes executes.
Now the image attached shows the chart as well as average turnaround time and average waiting time.
Please Note: the image contains average turnaround time and average waiting time.
Part c) Shortest remaining time first .
In this , context switching is allowed in this method .
It is similar to Shortest job first as the one with shortest burst time is served but switching is allowed in between the processes.
Now the image attached shows the chart as well as average turnaround time and average waiting time.
Please Note: the image contains average turnaround time and average waiting time.

Part D) Round Robin scheduling .
In the round robin method , we give each process a slot of time and then the queue is shifted to next process.
By doing this , we can prevent the processes from starvation.
Now the image attached shows the chart as well as average turnaround time and average waiting time.
Please Note: the image contains average turnaround time and average waiting time.

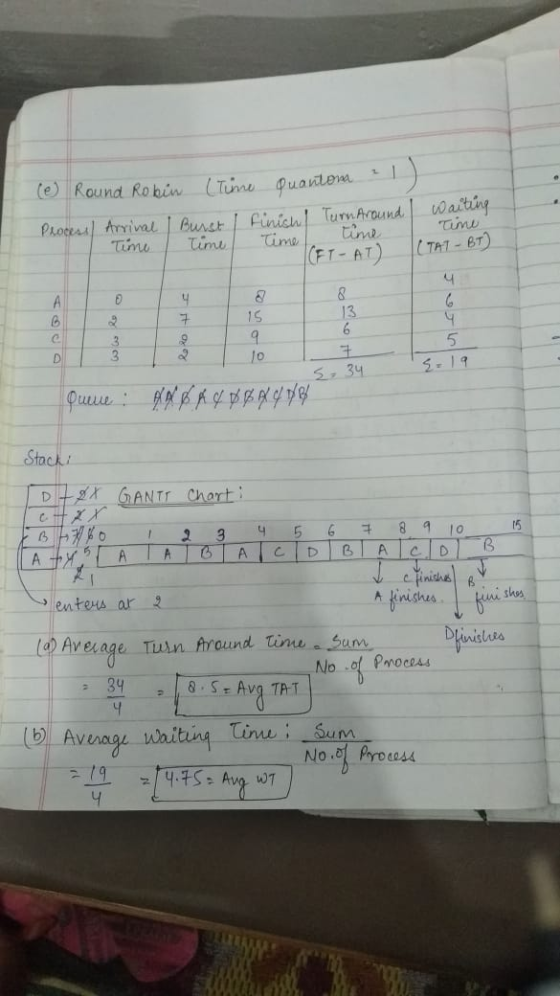
Part E) Round robin
This part is same as the above but with time quantom = 1.
Now the image attached shows the chart as well as average turnaround time and average waiting time.
Please Note: the image contains average turnaround time and average waiting time.
Thank you.
I hope i was able to provide you the desired answer.
if you have any queries please be comfortable to ask in the comments i will be glad to help.
:)
Add Answer to:
Answer ALL Questions 1. For the processes listed in Table 1, draw a chart illustrating their...
Given the following set of processes with corresponding execution times (in ms), arrival times and priority...
Given the following set of processes with corresponding execution times (in ms), arrival times and priority (1 – highest). For each scheduling algorithm: Construct a table showing which process is active and for how long until all processes are completely serviced (as done in class). Calculate the average waiting time and turnaround time. Process ID Burst (ms) Arrival time P1 9 0 P2 12 0 P3 3 0 P4 30 0 P5 20 0 P6 10 0 First Come First Serve...
Operating Siytem Concepts Homework No. 1 Variant No. 1 Student Cristian Anchei Paraschine (academic group, name,...
 Operating Siytem Concepts Homework No. 1 Variant No. 1 Student Cristian Anchei Paraschine (academic group, name, surname) I got the task.... (date, signature) Homework Submission Date: November 6th, 2019 Assignment: Consider the following set of processes, with the length of the CPU burst time given in milliseconds!: Process CPU burst time, ms Arrival time, ms Priority P 2 2 2 7 Ps 3 3 Draw a Gantt chart that illustrates process scheduling for these algorithms: a) First Come - First...
Assume that the three processes arrived in order: Processes CPU Burst Time P1 &n
Assume that the three processes arrived in order: Processes CPU Burst Time P1 17 P2 6 P3 8 a. Please draw the Gantt chart if FCFS scheduling is used. b. Please calculate the average waiting time and average completion time under FCFS. You MUST show the calculation procedure. c. Please draw the Gantt chart if Round Robin is used. d. Please calculate the average waiting time and completion time under RR with q = 3. You MUST show the calculation...
4. Consider a ready queue with four processes :- Process Arrival Time Burst Time (ms) P1...
 4. Consider a ready queue with four processes :- Process Arrival Time Burst Time (ms) P1 Priority P2 P3 P4 P5 For each of the following CPU scheduling algorithms, determine the turnaround and average waiting time for each of the process :- a. Shortest remaining Time First b. Shortest Job First C. Priority Scheduling (Both pre-emptive and non-preemptive) d. Round Robin (quantum is 1 ms)
Consider the following set of processes, with the length of the CPU-burst time given in milliseconds:
Consider the following set of processes, with the length of the CPU-burst time given in milliseconds:Processburst TimePriorityP1103P211P323P414P552For each of the scheduling algorithms, FCFS, Shortest-Job-First (SJF, non-preemptive), Priority (smaller priority number implies higher scheduling priority), and RR (quantum = 1) do the following.Draw a Gantt chart to show how these processes would be scheduled.Give the turnaround time (total time from the first arrival into ready state until CPU-burst is completed) of each process.Give the waiting time (total time spent in the Ready state) of each process.Give...
From the Gantt chart, the waiting time and the turnaround time are calculated as:
 Round Robin Schedulin ProcessBurst Time in MsP14P22P32Calculate the average waiting time and turnaround time using round robin scheduling, where the time quantum q = 2 ms According to the Round Robin algorithm, the arrival of processes is shown in the following Gantt chart. From the Gantt chart, the waiting time and the turnaround time are calculated as: Waiting time for P1= Waiting time for P2 = Waiting time for P2 = Therefore, the average waiting time = Turnaround time =
Practice question! Answer fast or no upvote. 4. Given the following table: Arrival Time Burst Time...
 Practice question! Answer fast or no upvote.
4. Given the following table: Arrival Time Burst Time Process P1 P2 P4 WN a) Calculate the average waiting time if shortest job first preemptive algorithm is applied. (5pts) b) Calculate the average turnaround time if round robin algorithm is applied with a time quantum of 3 units. (5pts)
Practice question! Answer fast or no upvote.
4. Given the following table: Arrival Time Burst Time Process P1 P2 P4 WN a) Calculate the average waiting time if shortest job first preemptive algorithm is applied. (5pts) b) Calculate the average turnaround time if round robin algorithm is applied with a time quantum of 3 units. (5pts)
8. Consider the following 5 processes in the ready queue: Process Burst Priority Arrival time n...
 8. Consider the following 5 processes in the ready queue: Process Burst Priority Arrival time n w P1 P2 w N P3 P P - W WE O P4 N P5 N A O Draw Gantt charts illustrating the execution of these processes for each of the following algorithms: (a) preemptive SJF, (b) RR (with quantum = 1), (C) FCFS, and (d) preemptive priority, and calculate the respective turnaround and waiting times.
Please answer the following question in C++ language Consider the following set of processes, with the...
Please answer the following question in C++ language Consider the following set of processes, with the length of the CPU burst time given in milliseconds: Process Burst Time Priority P1. 7 5 P2 2 4 P3 11 3 P4 9 1 P5 5 3 The processes are assumed to have arrived in the order P1,P2, P3, P4, P5, all at time 0. a. Draw four Gantt charts that illustrate the execution of these processes using the following scheduling algorithms: FCFS, SJF, nonpreemptive...
Here is a table of processes and their associated arrival and running times: Show the scheduling...
 Here is a table of processes and their associated arrival and running times: Show the scheduling order for these processes under First-Come-First-Served (FCFS), Shortest-Job First (SJF), and Round-Robin (RR) with a quantum = 1 time unit. Assume that the context switch overhead is 0 and new processes are added to the head of the queue (i.e. next in line for scheduling) except for FCFS. In the table, use notation such as P1, P2, etc.
 Operating Siytem Concepts Homework No. 1 Variant No. 1 Student Cristian Anchei Paraschine (academic group, name, surname) I got the task.... (date, signature) Homework Submission Date: November 6th, 2019 Assignment: Consider the following set of processes, with the length of the CPU burst time given in milliseconds!: Process CPU burst time, ms Arrival time, ms Priority P 2 2 2 7 Ps 3 3 Draw a Gantt chart that illustrates process scheduling for these algorithms: a) First Come - First...
 4. Consider a ready queue with four processes :- Process Arrival Time Burst Time (ms) P1 Priority P2 P3 P4 P5 For each of the following CPU scheduling algorithms, determine the turnaround and average waiting time for each of the process :- a. Shortest remaining Time First b. Shortest Job First C. Priority Scheduling (Both pre-emptive and non-preemptive) d. Round Robin (quantum is 1 ms)
 Practice question! Answer fast or no upvote.
4. Given the following table: Arrival Time Burst Time Process P1 P2 P4 WN a) Calculate the average waiting time if shortest job first preemptive algorithm is applied. (5pts) b) Calculate the average turnaround time if round robin algorithm is applied with a time quantum of 3 units. (5pts)
Practice question! Answer fast or no upvote.
4. Given the following table: Arrival Time Burst Time Process P1 P2 P4 WN a) Calculate the average waiting time if shortest job first preemptive algorithm is applied. (5pts) b) Calculate the average turnaround time if round robin algorithm is applied with a time quantum of 3 units. (5pts)
 8. Consider the following 5 processes in the ready queue: Process Burst Priority Arrival time n w P1 P2 w N P3 P P - W WE O P4 N P5 N A O Draw Gantt charts illustrating the execution of these processes for each of the following algorithms: (a) preemptive SJF, (b) RR (with quantum = 1), (C) FCFS, and (d) preemptive priority, and calculate the respective turnaround and waiting times.
 Here is a table of processes and their associated arrival and running times: Show the scheduling order for these processes under First-Come-First-Served (FCFS), Shortest-Job First (SJF), and Round-Robin (RR) with a quantum = 1 time unit. Assume that the context switch overhead is 0 and new processes are added to the head of the queue (i.e. next in line for scheduling) except for FCFS. In the table, use notation such as P1, P2, etc.
Most questions answered within 3 hours.
-
3) What are the typical social structures in a global city?
asked 1 hour ago -
Luther Corporation
Consolidated Balance Sheet
December 31, 2019 and 2018 (in $ millions)
Assets
2019
2018...
asked 1 hour ago -
(Expected rate of return and risk) Carter Inc. is evaluating a
security. Calculate the investment’s expected...
asked 3 hours ago -
What specific indicators can point to lack of progress for
African Americans in American society?
asked 4 hours ago -
1-The Electrons in a beam are moving at 2.7×10⁸ m/s in an
electric field of 15000...
asked 5 hours ago -
A gas tank is a vertical cylinder. It has a radius of 1m, a
height of...
asked 5 hours ago -
Accent Software faces the following conditions. All of these
support Accent’s use of a market-penetration pricing...
asked 6 hours ago -
A mathematically inclined friend emails you the following
instructions: "Meet me in the cafeteria the first...
asked 6 hours ago -
A monopoly sells in two countries . The demand curves in the two
countries are p1...
asked 7 hours ago -
A .15kg rubber ball is bounced off a wall. Before hitting the
wall, the ball moves...
asked 8 hours ago -
A manufacturing company preparing to build a new plant is
considering three potential locations for it....
asked 8 hours ago -
B. If compound Y has approximately the same values of solubility
in toluene as compound X,...
asked 9 hours ago