
Please help! Only Multiple Choice.
Homework Answers
Solution:-
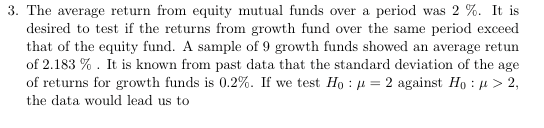
3) (d) Rejection of null hypothesis at 10% level of significance but acceptance at 0.1% level of significance.
State the hypotheses. The first step is to state the null hypothesis and an alternative hypothesis.
Null hypothesis: u = 2.0
Alternative hypothesis: u > 2.0
Note that these hypotheses constitute a one-tailed test. The null hypothesis will be rejected if the sample mean is too small.
Formulate an analysis plan. For this analysis, the significance level is 0.10. The test method is a one-sample t-test.
Analyze sample data. Using sample data, we compute the standard error (SE), degrees of freedom (DF), and the t statistic test statistic (t).
SE = s / sqrt(n)
S.E = 0.0667
DF = n - 1
D.F = 8
t = (x - u) / SE
t = 2.745
where s is the standard deviation of the sample, x is the sample mean, u is the hypothesized population mean, and n is the sample size.
The observed sample mean produced a t statistic test statistic of 2.745
Thus the P-value in this analysis is 0.013
Interpret results.
Interpret results. Since the P-value (0.013) is less than the significance level (0.10), we have to reject the null hypothesis.Since the P-value (0.013) is greater than the significance level (0.001), we failed to reject the null hypothesis.
(d) Rejection of null hypothesis at 10% level of significance but acceptance at 0.1% level of significance.
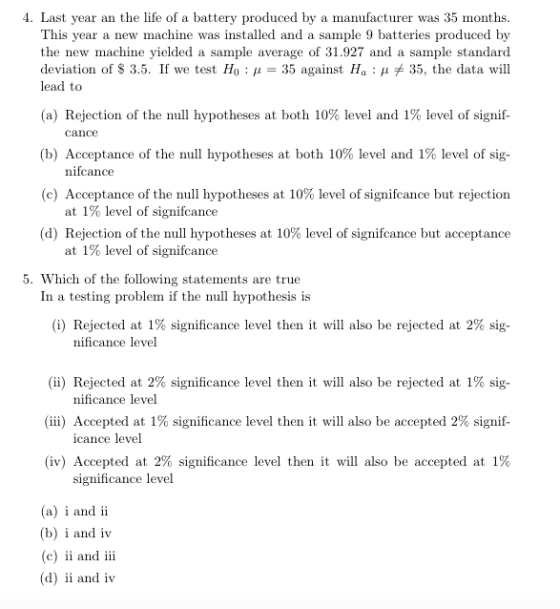
4) (d) Rejection of null hypothesis at 10% level of significance but acceptance at 0.1% level of significance.
State the hypotheses. The first step is to state the null hypothesis and an alternative hypothesis.
Null hypothesis: u = 35
Alternative hypothesis: u 35
Note that these hypotheses constitute a two-tailed test. The null hypothesis will be rejected if the sample mean is too big or if it is too small.
Formulate an analysis plan. For this analysis, the significance level is 0.10. The test method is a one-sample t-test.
Analyze sample data. Using sample data, we compute the standard error (SE), degrees of freedom (DF), and the t statistic test statistic (t).
SE = s / sqrt(n)
S.E = 0.5916
DF = n - 1
D.F = 8
t = (x - u) / SE
t = - 2.634
where s is the standard deviation of the sample, x is the sample mean, u is the hypothesized population mean, and n is the sample size.
Since we have a two-tailed test, the P-value is the probability that the t statistic having 8 degrees of freedom is less than -2.634 or greater than 2.634.
Thus, the P-value = 0.03
Interpret results. Interpret results. Since the P-value (0.03) is less than the significance level (0.10), we have to reject the null hypothesis.
Since the P-value (0.03) is greater than the significance level (0.001), we failed to reject the null hypothesis.
(d) Rejection of null hypothesis at 10% level of significance but acceptance at 0.1% level of significance.
Add Answer to:
Please help! Only Multiple Choice.
3. The average return from equity mutual funds over a period...
plz help with all questions 180-2100 I. Multiple-choice (Circle the letter of your answer): = 100...
 plz help with all questions
180-2100 I. Multiple-choice (Circle the letter of your answer): = 100 and (1) For a continuous random variable 1, the population mean and standard deviation are o 20 respectively. the mean jy and the standard deviation og of the sample mean for a random sample of 16 items from this population are ( 5 0.05) (A) Pa = 25, ; 20 (B) P = 100, -20 (C) = 25,0 = 5 (D) Hg = 100,...
plz help with all questions
180-2100 I. Multiple-choice (Circle the letter of your answer): = 100 and (1) For a continuous random variable 1, the population mean and standard deviation are o 20 respectively. the mean jy and the standard deviation og of the sample mean for a random sample of 16 items from this population are ( 5 0.05) (A) Pa = 25, ; 20 (B) P = 100, -20 (C) = 25,0 = 5 (D) Hg = 100,...
Need a little help. Please help You wish to test the claim that the average IQ...
Need a little help. Please help You wish to test the claim that the average IQ score is less than 100 at the .10 significance level. You determine the hypotheses are: Ho : μ = 100 H 1 : μ < 100 You take a simple random sample of 41 individuals and find the mean IQ score is 97.2, with a standard deviation of 14.9. Let's consider testing this hypothesis two ways: once with assuming the population standard deviation is...
1.3.3 Question Help * Sample 1 Sample 2 Assume that both populations are normally distributed. a)...
 1.3.3 Question Help * Sample 1 Sample 2 Assume that both populations are normally distributed. a) Test whether μ? μ2 at the α 0.05 level of significance for the given sample data. b) Construct a 95% confidence interval about μ1-2. 16 44.1 12.4 52.5 9.7 EB Click the icon to view the Student t-distribution table a) Perform a hypothesis test. Determine the null and alternative hypotheses Determine the critical value(s). Select the correct choice bElow and fill in the answer...
Please Help A supermarket chain wants to know if its "buy one, get one free" campaign...
Please Help A supermarket chain wants to know if its "buy one, get one free" campaign increases customer traffic enough to justify the cost of the program. For each of 5 stores it selects two days to run the test. For one of those days the program will be in effect. At 1% significance level, test the claim that the program increases traffic. Use t-distribution. For parts (a), (b), (c), round your answers to 2 decimal places. (a) ¯dd¯ =...
Please answer all 3 questions mpus A test of sobriety involves measuring the subject's motor skills....
 Please answer all 3 questions
mpus A test of sobriety involves measuring the subject's motor skills. Twenty randomly selected sober subjects take the test and produce a mean score of 41.0 with a standard deviation of 3.7. At the 0.01 level of significance, test the claim that the true mean score for all sober subjects is equal to 40.0. Use the traditional method of testing hypotheses. The results for the test turn out to be: Hopp = 40.0.HAP 40.0. Test...
Please answer all 3 questions
mpus A test of sobriety involves measuring the subject's motor skills. Twenty randomly selected sober subjects take the test and produce a mean score of 41.0 with a standard deviation of 3.7. At the 0.01 level of significance, test the claim that the true mean score for all sober subjects is equal to 40.0. Use the traditional method of testing hypotheses. The results for the test turn out to be: Hopp = 40.0.HAP 40.0. Test...
Please help me with my whole assigment 1. [7 marks in total] A statistics practitioner took...
 Please help me with my whole assigment
1. [7 marks in total] A statistics practitioner took a random sample of 31 observations from a normal population. The sample standard deviation is 34 and the sample mean is 97. Note: For each confidence interval, enter your answer in the form (LCL", UCL"). You must include the parentheses and the comma between the confidence limits. A. Estimate the population mean with 95% confidence. Diagram Confidence interval B. Estimate the population mean with...
Please help me with my whole assigment
1. [7 marks in total] A statistics practitioner took a random sample of 31 observations from a normal population. The sample standard deviation is 34 and the sample mean is 97. Note: For each confidence interval, enter your answer in the form (LCL", UCL"). You must include the parentheses and the comma between the confidence limits. A. Estimate the population mean with 95% confidence. Diagram Confidence interval B. Estimate the population mean with...
Please help- Check, then solve the rest... Two methods were used to teach a high school...
 Please help- Check, then solve the rest...
Two methods were used to teach a high school alge was selected for method 1, and a sample of 35 scores was results are: nool algebra course. A sample of 32 scores S scores was selected for method 2. The Method 1 Sample mean: 87.2 Sample sd: 2.1 Method 2 84.6 3.1 Test whether method 1 was more successful than method 2 at the 1% level. Part a: State your null and alternative...
Please help- Check, then solve the rest...
Two methods were used to teach a high school alge was selected for method 1, and a sample of 35 scores was results are: nool algebra course. A sample of 32 scores S scores was selected for method 2. The Method 1 Sample mean: 87.2 Sample sd: 2.1 Method 2 84.6 3.1 Test whether method 1 was more successful than method 2 at the 1% level. Part a: State your null and alternative...
The following hypotheses are given. H0 : π ≤ 0.83 H1 : π > 0.83 A...
The following hypotheses are given. H0 : π ≤ 0.83 H1 : π > 0.83 A sample of 100 observations revealed that p = 0.87. At the 0.10 significance level, can the null hypothesis be rejected? State the decision rule. (Round your answer to 2 decimal places.) Compute the value of the test statistic. (Round your answer to 2 decimal places.) What is your decision regarding the null hypothesis? Do not reject H0. Reject H0. question 2: The number of...
Question 5 An carlier study claimed that U.S adults spent an average of 114 minutes per...
 Question 5 An carlier study claimed that U.S adults spent an average of 114 minutes per day with their family. A recently raken sample of 25 adults from a city show'eod that they spend an average of 109 minutes per day with their family, Ihe population deviation is I1 minutes. Assume that the times spent by adults with their families have an approximate normal distribution Using a 1% significance level test whether the mean time spent currently by all adults...
Economics- Probability and stats 1. Find the value of the 75th percentile of the following array:...
 Economics- Probability and stats
1. Find the value of the 75th percentile of the following array: 5,10,43,9,8,6,2,5 A) 8 B) 9 C) 9.5 D) 8.5 2. Two independent events, A and B, where the P(B) is 0.44 and the probability that A does not occur or B occurs is 0.74. What is the probability that event A occurs? A) 0.3 B) 0.54 C) 0.46 D) 0.28 3. Which of the following is FALSE? A) B) A sampling distribution is a...
Economics- Probability and stats
1. Find the value of the 75th percentile of the following array: 5,10,43,9,8,6,2,5 A) 8 B) 9 C) 9.5 D) 8.5 2. Two independent events, A and B, where the P(B) is 0.44 and the probability that A does not occur or B occurs is 0.74. What is the probability that event A occurs? A) 0.3 B) 0.54 C) 0.46 D) 0.28 3. Which of the following is FALSE? A) B) A sampling distribution is a...
 plz help with all questions
180-2100 I. Multiple-choice (Circle the letter of your answer): = 100 and (1) For a continuous random variable 1, the population mean and standard deviation are o 20 respectively. the mean jy and the standard deviation og of the sample mean for a random sample of 16 items from this population are ( 5 0.05) (A) Pa = 25, ; 20 (B) P = 100, -20 (C) = 25,0 = 5 (D) Hg = 100,...
plz help with all questions
180-2100 I. Multiple-choice (Circle the letter of your answer): = 100 and (1) For a continuous random variable 1, the population mean and standard deviation are o 20 respectively. the mean jy and the standard deviation og of the sample mean for a random sample of 16 items from this population are ( 5 0.05) (A) Pa = 25, ; 20 (B) P = 100, -20 (C) = 25,0 = 5 (D) Hg = 100,...
 1.3.3 Question Help * Sample 1 Sample 2 Assume that both populations are normally distributed. a) Test whether μ? μ2 at the α 0.05 level of significance for the given sample data. b) Construct a 95% confidence interval about μ1-2. 16 44.1 12.4 52.5 9.7 EB Click the icon to view the Student t-distribution table a) Perform a hypothesis test. Determine the null and alternative hypotheses Determine the critical value(s). Select the correct choice bElow and fill in the answer...
 Please answer all 3 questions
mpus A test of sobriety involves measuring the subject's motor skills. Twenty randomly selected sober subjects take the test and produce a mean score of 41.0 with a standard deviation of 3.7. At the 0.01 level of significance, test the claim that the true mean score for all sober subjects is equal to 40.0. Use the traditional method of testing hypotheses. The results for the test turn out to be: Hopp = 40.0.HAP 40.0. Test...
Please answer all 3 questions
mpus A test of sobriety involves measuring the subject's motor skills. Twenty randomly selected sober subjects take the test and produce a mean score of 41.0 with a standard deviation of 3.7. At the 0.01 level of significance, test the claim that the true mean score for all sober subjects is equal to 40.0. Use the traditional method of testing hypotheses. The results for the test turn out to be: Hopp = 40.0.HAP 40.0. Test...
 Please help me with my whole assigment
1. [7 marks in total] A statistics practitioner took a random sample of 31 observations from a normal population. The sample standard deviation is 34 and the sample mean is 97. Note: For each confidence interval, enter your answer in the form (LCL", UCL"). You must include the parentheses and the comma between the confidence limits. A. Estimate the population mean with 95% confidence. Diagram Confidence interval B. Estimate the population mean with...
Please help me with my whole assigment
1. [7 marks in total] A statistics practitioner took a random sample of 31 observations from a normal population. The sample standard deviation is 34 and the sample mean is 97. Note: For each confidence interval, enter your answer in the form (LCL", UCL"). You must include the parentheses and the comma between the confidence limits. A. Estimate the population mean with 95% confidence. Diagram Confidence interval B. Estimate the population mean with...
 Please help- Check, then solve the rest...
Two methods were used to teach a high school alge was selected for method 1, and a sample of 35 scores was results are: nool algebra course. A sample of 32 scores S scores was selected for method 2. The Method 1 Sample mean: 87.2 Sample sd: 2.1 Method 2 84.6 3.1 Test whether method 1 was more successful than method 2 at the 1% level. Part a: State your null and alternative...
Please help- Check, then solve the rest...
Two methods were used to teach a high school alge was selected for method 1, and a sample of 35 scores was results are: nool algebra course. A sample of 32 scores S scores was selected for method 2. The Method 1 Sample mean: 87.2 Sample sd: 2.1 Method 2 84.6 3.1 Test whether method 1 was more successful than method 2 at the 1% level. Part a: State your null and alternative...
 Question 5 An carlier study claimed that U.S adults spent an average of 114 minutes per day with their family. A recently raken sample of 25 adults from a city show'eod that they spend an average of 109 minutes per day with their family, Ihe population deviation is I1 minutes. Assume that the times spent by adults with their families have an approximate normal distribution Using a 1% significance level test whether the mean time spent currently by all adults...
 Economics- Probability and stats
1. Find the value of the 75th percentile of the following array: 5,10,43,9,8,6,2,5 A) 8 B) 9 C) 9.5 D) 8.5 2. Two independent events, A and B, where the P(B) is 0.44 and the probability that A does not occur or B occurs is 0.74. What is the probability that event A occurs? A) 0.3 B) 0.54 C) 0.46 D) 0.28 3. Which of the following is FALSE? A) B) A sampling distribution is a...
Economics- Probability and stats
1. Find the value of the 75th percentile of the following array: 5,10,43,9,8,6,2,5 A) 8 B) 9 C) 9.5 D) 8.5 2. Two independent events, A and B, where the P(B) is 0.44 and the probability that A does not occur or B occurs is 0.74. What is the probability that event A occurs? A) 0.3 B) 0.54 C) 0.46 D) 0.28 3. Which of the following is FALSE? A) B) A sampling distribution is a...
Most questions answered within 3 hours.
-
Work of 1950 J is done by stirring a perfectly insulated beaker
containing 75 g of...
asked 3 minutes ago -
The neighborhood kids set up an outdoor lemonade stand in
Maryland in June. They find that...
asked 4 minutes ago -
9. A company has a beginning inventory of 4,000 units. The
company estimates it will sell...
asked 18 minutes ago -
A patient goes to the doctor's office with symptoms of a urinary
tract infection and provides...
asked 20 minutes ago -
When responding to the essay questions, be sure to cite any
material you obtained from a...
asked 20 minutes ago -
The energy of an electron in a 2.25-eV-deep potential well is
1.50 eV.At what distance into...
asked 22 minutes ago -
Q1:Which three evolutionary innovations are present in land
plants (but not all land plants) that allowed...
asked 25 minutes ago -
Lymphosarcoma is
extremely rare. Risk factors for the disease are largely unknown.
What kind of study...
asked 27 minutes ago -
The solubility of benzoic acid in water is:
0.29g/100mL at 20°C
6.8g/100mL at 100°C
a) What...
asked 28 minutes ago -
Which food law was passed in 1996 and changed how pesticide
residues on food were regulated...
asked 46 minutes ago -
companies either hire outside programmers to
write_____ software or use their own internal developers.
asked 46 minutes ago -
A magnetic dipole m(t) = m_0*cos(ωt) can be
described as current density j(r,t) = −cm(t) ×...
asked 45 minutes ago