
Homework Answers
| Price level | Value of money |
| 1 | 1 |
| 1.33 | 0.75 |
| 2 | 0.5 |
| 4 | 0.25 |
The lower the price level, The LESS money typical transaction requires and the LESS money people will wish to hold.
Reason- When price level falls, the money required will be less as transaction requires less money.
The Equilibrium value of money is 0.5 and equilibrium Price is 2.
fed can use open market operations to SELL BONDS TO THE PUBLIC.
Quantity of money supplied is LESS than the quantity of money demanded.
This contractions in money supply will Reduce peoples demand.
The price of goods and services will fall and value of money will RISE.
reason- There is inverse relationship between price and value of money.
If it helps kindly upvote
Add Answer to:
Fill in the value of Money column in the following table. Quantity of Money Demanded Price...
Fill in the Value of Money column in the following table. Price Level (P) Value of...
 Fill in the Value of Money column in the following table. Price Level (P) Value of Money 0.80 1.25 1.00 1.00 1.33 0.75 2.00 0.50 Quantity of Money Demanded (Billions of dollars) 2.0 2.5 4.0 8.0 Now consider the relationship between the price level and the quantity of money that people demand. The lower the price level, the money the typical transaction requires, and the money people will wish to hold in the form of currency or demand deposits. Assume...
2. Money supply, money demand, and adjustment to monetary equilibrium The following table shows a money...
 2. Money supply, money demand, and adjustment to monetary equilibrium The following table shows a money demand schedule, which is the quantity of money demanded at various price levels (P). Fill in the value of Money column in the following table. Price Level (P) Value of Money (1/P) Quantity of Money Demanded (Billions of dollars) 2.0 1.00 1.33 2.5 4.0 2.00 4.00 8.0 money the Now consider the relationship between the price level and the quantity of money that people...
2. Money supply, money demand, and adjustment to monetary equilibrium The following table shows a money...
 2. Money supply, money demand, and adjustment to monetary equilibrium The following table shows a money demand schedule, which is the quantity of money demanded at various price levels (P). Fill in the Value of Money column in the following table. Now consider the relationship between the price level and the quantity of money that people demand. The lower the price level, the _______ money the typical transaction requires, and the _______ money people will wish to hold in the form of currency...
2. Money supply, money demand, and adjustment to monetary equilibrium The following table shows a money...
 2. Money supply, money demand, and adjustment to monetary equilibrium The following table shows a money demand schedule, which is the quantity of money demanded at various price levels (P Fill in the Value of Money column in the following table. Price Level (P) 0.80 1.00 1.33 Quantity of Money Demanded Billions of dollars) 2.0 2.5 4.0 8.0 Value of Money (1/P) Now consider the relationship between the price level and the quantity of money that people demand. The lower...
2. Money supply, money demand, and adjustment to monetary equilibrium The following table shows a money...
 2. Money supply, money demand, and adjustment to monetary equilibrium The following table shows a money demand schedule, which is the quantity of money demanded at various price levels (P). Fill in the value of Money column in the following table. Quantity of Money Demanded (Billions of dollars) Price Level (P) 1.00 1.5 Value of Money (1/P) 1.00 0.75 0.50 2.0 1.33 2.00 4.00 3.5 7.0 0.25 money Now consider the relationship between the price level and the quantity of...
2. Money supply, money demand, and adjustment to monetary equilibrium The following table shows a money...
 2. Money supply, money demand, and adjustment to monetary equilibrium The following table shows a money demand schedule, which is the quantity of money demanded at various price levels (P). Fill in the value of Money column in the following table. Price Level (P) Value of Money (1/P) Quantity of Money Demanded (Billions of dollars) 1.5 0.80 0.40 1.00 1.00 2.0 1.33 1.33 3.5 2.00 0.50 7.0 Now consider the relationship between the price level and the quantity of money...
2. Money supply, money demand, and adjustment to monetary equilibrium The following table shows a money...
 2. Money supply, money demand, and adjustment to monetary equilibrium The following table shows a money demand schedule, which is the quantity of money demanded at various price levels (P). Fill in the Value of Money column in the following table. Now consider the relationship between the price level and the quantity of money that people demand. The lower the price level, the less money the typical transaction requires, and the less money people will wish to hold in the form of currency...
do graph. and question answers 2. Money supply, money demand, and adjustment to monetary equilibri following...
 do
graph. and question answers
2. Money supply, money demand, and adjustment to monetary equilibri following table shows a money demand schedule, which is the quantity of money demanded at various price levels (P. Fill in the Value of Money column in the following table. Price Level (P) 1.00 1.33 2.00 4.00 Quantity of Money Demanded (Billions of dollars) 1.5 2.0 3.5 7.0 Value of Money (1/P) 1.00 Y 0.75 0.50Y 0.25 Y Now consider the relationship between the price...
do
graph. and question answers
2. Money supply, money demand, and adjustment to monetary equilibri following table shows a money demand schedule, which is the quantity of money demanded at various price levels (P. Fill in the Value of Money column in the following table. Price Level (P) 1.00 1.33 2.00 4.00 Quantity of Money Demanded (Billions of dollars) 1.5 2.0 3.5 7.0 Value of Money (1/P) 1.00 Y 0.75 0.50Y 0.25 Y Now consider the relationship between the price...
The following table shows the quantity of money supplied and the quantity of money demanded for various interest rates 4...
 The following table shows the quantity of money supplied and the
quantity of money demanded for various interest rates
4. Study Questions and Problems #4 The following table shows the quantity of money supplied and the quantity of money demanded for various interest rates. Interest Rate (Percent) Demand for Money (Billions of dollars) Supply of Money (Billions of dollars) 500 100 300 500 500 700 900 500 500 500 The following graph depicts the money supply curve in orange. On...
The following table shows the quantity of money supplied and the
quantity of money demanded for various interest rates
4. Study Questions and Problems #4 The following table shows the quantity of money supplied and the quantity of money demanded for various interest rates. Interest Rate (Percent) Demand for Money (Billions of dollars) Supply of Money (Billions of dollars) 500 100 300 500 500 700 900 500 500 500 The following graph depicts the money supply curve in orange. On...
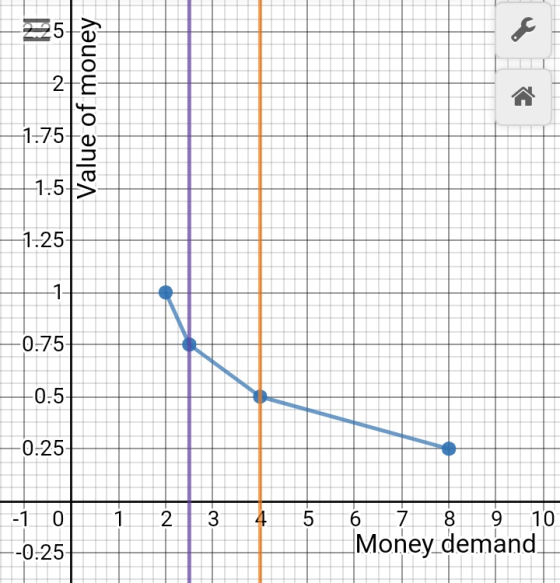
MS1 MS2 Increase in money supply 0.50 Money demand 7.0 3.5 Quantity of money (billions of...
 MS1 MS2 Increase in money supply 0.50 Money demand 7.0 3.5 Quantity of money (billions of dollars) Value of money According to your graph, the equilibrium value of money is therefore the equilibrium price level is Now, suppose that the Fed reduces the money supply from the initial level of $3.5 billion to $2 billion. the public In order to reduce the money supply, the Fed can use open market operations to
 Fill in the Value of Money column in the following table. Price Level (P) Value of Money 0.80 1.25 1.00 1.00 1.33 0.75 2.00 0.50 Quantity of Money Demanded (Billions of dollars) 2.0 2.5 4.0 8.0 Now consider the relationship between the price level and the quantity of money that people demand. The lower the price level, the money the typical transaction requires, and the money people will wish to hold in the form of currency or demand deposits. Assume...
 2. Money supply, money demand, and adjustment to monetary equilibrium The following table shows a money demand schedule, which is the quantity of money demanded at various price levels (P). Fill in the value of Money column in the following table. Price Level (P) Value of Money (1/P) Quantity of Money Demanded (Billions of dollars) 2.0 1.00 1.33 2.5 4.0 2.00 4.00 8.0 money the Now consider the relationship between the price level and the quantity of money that people...
 2. Money supply, money demand, and adjustment to monetary equilibrium The following table shows a money demand schedule, which is the quantity of money demanded at various price levels (P Fill in the Value of Money column in the following table. Price Level (P) 0.80 1.00 1.33 Quantity of Money Demanded Billions of dollars) 2.0 2.5 4.0 8.0 Value of Money (1/P) Now consider the relationship between the price level and the quantity of money that people demand. The lower...
 2. Money supply, money demand, and adjustment to monetary equilibrium The following table shows a money demand schedule, which is the quantity of money demanded at various price levels (P). Fill in the value of Money column in the following table. Quantity of Money Demanded (Billions of dollars) Price Level (P) 1.00 1.5 Value of Money (1/P) 1.00 0.75 0.50 2.0 1.33 2.00 4.00 3.5 7.0 0.25 money Now consider the relationship between the price level and the quantity of...
 2. Money supply, money demand, and adjustment to monetary equilibrium The following table shows a money demand schedule, which is the quantity of money demanded at various price levels (P). Fill in the value of Money column in the following table. Price Level (P) Value of Money (1/P) Quantity of Money Demanded (Billions of dollars) 1.5 0.80 0.40 1.00 1.00 2.0 1.33 1.33 3.5 2.00 0.50 7.0 Now consider the relationship between the price level and the quantity of money...
 do
graph. and question answers
2. Money supply, money demand, and adjustment to monetary equilibri following table shows a money demand schedule, which is the quantity of money demanded at various price levels (P. Fill in the Value of Money column in the following table. Price Level (P) 1.00 1.33 2.00 4.00 Quantity of Money Demanded (Billions of dollars) 1.5 2.0 3.5 7.0 Value of Money (1/P) 1.00 Y 0.75 0.50Y 0.25 Y Now consider the relationship between the price...
do
graph. and question answers
2. Money supply, money demand, and adjustment to monetary equilibri following table shows a money demand schedule, which is the quantity of money demanded at various price levels (P. Fill in the Value of Money column in the following table. Price Level (P) 1.00 1.33 2.00 4.00 Quantity of Money Demanded (Billions of dollars) 1.5 2.0 3.5 7.0 Value of Money (1/P) 1.00 Y 0.75 0.50Y 0.25 Y Now consider the relationship between the price...
 The following table shows the quantity of money supplied and the
quantity of money demanded for various interest rates
4. Study Questions and Problems #4 The following table shows the quantity of money supplied and the quantity of money demanded for various interest rates. Interest Rate (Percent) Demand for Money (Billions of dollars) Supply of Money (Billions of dollars) 500 100 300 500 500 700 900 500 500 500 The following graph depicts the money supply curve in orange. On...
The following table shows the quantity of money supplied and the
quantity of money demanded for various interest rates
4. Study Questions and Problems #4 The following table shows the quantity of money supplied and the quantity of money demanded for various interest rates. Interest Rate (Percent) Demand for Money (Billions of dollars) Supply of Money (Billions of dollars) 500 100 300 500 500 700 900 500 500 500 The following graph depicts the money supply curve in orange. On...
 MS1 MS2 Increase in money supply 0.50 Money demand 7.0 3.5 Quantity of money (billions of dollars) Value of money According to your graph, the equilibrium value of money is therefore the equilibrium price level is Now, suppose that the Fed reduces the money supply from the initial level of $3.5 billion to $2 billion. the public In order to reduce the money supply, the Fed can use open market operations to
Most questions answered within 3 hours.
-
Explain some different types of fungi. State the different
divisions undergo by fungi.
asked 6 minutes ago -
The shortest time that 120 C can flow through a 20 A circuit
breaker without tripping...
asked 7 minutes ago -
A software design pattern is a general, reusable solution to a
commonly occurring problem, acting as...
asked 10 minutes ago -
The mean waiting time at the drive-through of a fast-food
restaurant from the time an order...
asked 26 minutes ago -
The pitch (p) of a helix is defined as p = dn, in which n is...
asked 28 minutes ago -
Do you agree that the declining stock of social capital is the
blame for the failure...
asked 32 minutes ago -
A researcher is interested in whether coffee consumption helps
with performance on reading comprehension tasks. The...
asked 42 minutes ago -
it has been estimated since the beginning of the human race that
about 133 metric ton...
asked 47 minutes ago -
Where must Medicare prescription drug plans allow for
participants to fill their prescriptions?
asked 50 minutes ago -
Five moles of monatomic ideal gas have initial pressure 2.50 ×
103 Pa and initial volume...
asked 1 hour ago -
A resistor and the capacitor are used to control the timing in
the RC circuit of...
asked 1 hour ago -
Living in a group could bring several disadvantages to an
individual. What are some of the...
asked 1 hour ago