

Homework Answers
Solution:
a)

b)
The correct option is A
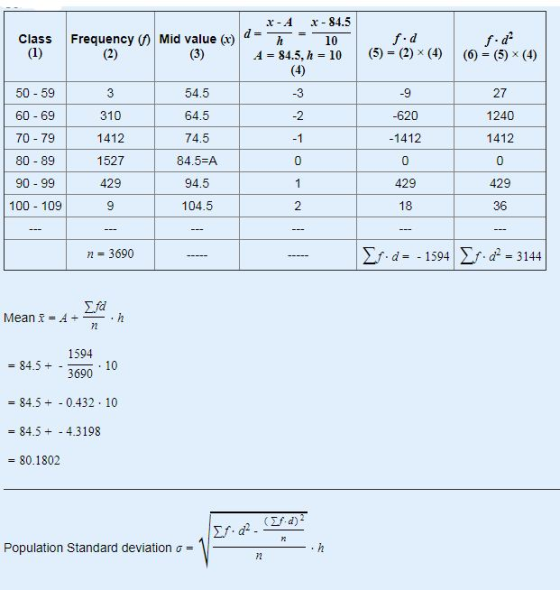
The frequency histogram of the data is bell shaped
c)
Using empirical rule
95% of days in month will be between
95% ≈ M ± 2SD = 80.18 ± 2(8.157) = 63.866 to 96.494
Add Answer to:
The following data represent the high-temperature distribution for a summer month in a city for some...
(c) According to the empirical rule, 95% of days in the month will be between what...
 (c) According to the empirical rule, 95% of days in the month
will be between what two temperatures?
MAT 152 OL1 Spring 2019 (1) Homework: 3.3 Measures from Grouped Data Score: 0.2 of 1 pt Emely Palacios 1/31/19 7:35 3 of 7 (6 complete) Hw Score: 67.14%, 4.7 3.3.5 EQuestion Help The following data represent the high-temperature distribution for a summer month in a city for some of the last 130 years. Treat the data as a population. Temperature (a)...
(c) According to the empirical rule, 95% of days in the month
will be between what two temperatures?
MAT 152 OL1 Spring 2019 (1) Homework: 3.3 Measures from Grouped Data Score: 0.2 of 1 pt Emely Palacios 1/31/19 7:35 3 of 7 (6 complete) Hw Score: 67.14%, 4.7 3.3.5 EQuestion Help The following data represent the high-temperature distribution for a summer month in a city for some of the last 130 years. Treat the data as a population. Temperature (a)...
Save Homework: HW CH 3 Score: 1.33 of 4 pts % 3.3.5-T 9 of 10 (10...
 Save Homework: HW CH 3 Score: 1.33 of 4 pts % 3.3.5-T 9 of 10 (10 complete) HW Score: 90.67%, 31.73 of 35 pts Question Help The following data represent the high-temperature distribution for a summer month in a city for some of the last 130 years. Treat the data as a population. Complete parts (a) through (c). Temperature (°F) 50-59 60-69 70-79 80-89 90-99 100-109 Days 315 1452 1519 267 (a) Approximate the mean and standard deviation for temperature...
Those questions are for the same question, please answer all of them. Thanks~ eBook Each year...
 Those questions are for the same question, please answer all of
them. Thanks~
eBook Each year America.EDU ranks the best paying college degrees In America. The followlng data show the medlan starting salary, the mld-career salary, and the percentage Increase from starting salary to mld career salary for the 20 college degrees with the highest mid-career salary (America.EDU website, August 29, 2013) Click on the datafile logo to reference the data DATA file Starting Salary Mid-Career Salary %Increase Aerospace engineering...
Those questions are for the same question, please answer all of
them. Thanks~
eBook Each year America.EDU ranks the best paying college degrees In America. The followlng data show the medlan starting salary, the mld-career salary, and the percentage Increase from starting salary to mld career salary for the 20 college degrees with the highest mid-career salary (America.EDU website, August 29, 2013) Click on the datafile logo to reference the data DATA file Starting Salary Mid-Career Salary %Increase Aerospace engineering...
2.9 Question Help The table available below is the frequency distribution for data of the pulse...
 2.9 Question Help The table available below is the frequency distribution for data of the pulse rates (beats per minute) of males. Use the frequency distribution to construct a histogram Use class midpoint values for the horizontal scale. Do the pulse rates of males appear to have a normal distribution? EB Click the icon to view the frequency distribution of the pulse rates of males. Which histogram below shows the data? O A 45 54.5 645 74.5 84.5 94.5 104.5...
In Exercises 29–32, find the mean of the data summarized in the frequency distribution. Also, compare...
 In Exercises 29–32, find the mean of the data summarized in the frequency distribution. Also, compare the computed means to the actual means obtained by using the original list of data values, which are as follows: (Exercise 29) 36.2 years; (Exercise 30) 44.1 years; (Exercise 31) 224.3: (Exercise 32) 255.1. 30. 29. Frequency Age (yr) of Best Actress When Oscar Was Won 20-29 28 30-39 Frequency 29 34 14 3 5 Age (yr) of Best Actor When Oscar Was Won...
The following data represents the age of 30 lottery winners. 24 26 27 28 28 29...
The following data represents the age of 30 lottery winners. 24 26 27 28 28 29 34 41 41 43 46 47 49 50 51 55 56 56 57 59 61 62 63 70 72 74 78 78 79 81 Complete the frequency distribution for the data. Age Frequency 20-29 30-39 40-49 50-59 60-69 70-79 80-89
1) a) The following distribution shows the number of cars sold each month by a garage...
 1) a) The following distribution shows the number of cars sold each month by a garage over a period of 3 years: 8 9 10 11 12 13 14 15 Number of cars (x) Number of months (f) 1 4 5 8 5 4 5 4 State whether the variable measured is continuous or discrete and find the mode, the mean and the median. (6 marks) b) The weight (in kg) of 40 patients of the Berkshire Hospital are summarised...
The following frequency distribution shows the number of passengers who flew on a small regional aircraft...
The following frequency distribution shows the number of passengers who flew on a small regional aircraft company’s flight number 1853 for the past 50 days. Number of passengers on Flight 1853 Frequency (days) Relative Frequency Cumulative Relative Frequency 50 to 59 5 60 to 69 13 70 to 79 17 80 to 89 7 90 to 99 6 100 to 109 2 Use this data to construct a relative frequency and cumulative relative frequency distribution. Report all of your answers...
The following data represents the age of 30 lottery winners. 22 26 26 31 38 38...
The following data represents the age of 30 lottery winners. 22 26 26 31 38 38 42 44 44 44 45 46 48 50 51 51 52 54 55 60 62 63 71 71 73 75 78 79 80 86 Complete the frequency distribution for the data. Age Frequency 20-29 30-39 40-49 50-59 60-69 70-79 80-89
Construct the cumulative frequenoy distribution for the given data. Age (years) of Best Actress when award...
 Construct the cumulative frequenoy distribution for the given data. Age (years) of Best Actress when award was won Frequency Age (years) of Best Actress when award was won Less than 30 Less than 40 Less than 50 Less than 60 Less than 70 Less than 80 Less than 90 Cumulative Frequency 20-29 30-39 40-49 50-59 60-69 70-79 80-89 29 36 14
 (c) According to the empirical rule, 95% of days in the month
will be between what two temperatures?
MAT 152 OL1 Spring 2019 (1) Homework: 3.3 Measures from Grouped Data Score: 0.2 of 1 pt Emely Palacios 1/31/19 7:35 3 of 7 (6 complete) Hw Score: 67.14%, 4.7 3.3.5 EQuestion Help The following data represent the high-temperature distribution for a summer month in a city for some of the last 130 years. Treat the data as a population. Temperature (a)...
(c) According to the empirical rule, 95% of days in the month
will be between what two temperatures?
MAT 152 OL1 Spring 2019 (1) Homework: 3.3 Measures from Grouped Data Score: 0.2 of 1 pt Emely Palacios 1/31/19 7:35 3 of 7 (6 complete) Hw Score: 67.14%, 4.7 3.3.5 EQuestion Help The following data represent the high-temperature distribution for a summer month in a city for some of the last 130 years. Treat the data as a population. Temperature (a)...
 Save Homework: HW CH 3 Score: 1.33 of 4 pts % 3.3.5-T 9 of 10 (10 complete) HW Score: 90.67%, 31.73 of 35 pts Question Help The following data represent the high-temperature distribution for a summer month in a city for some of the last 130 years. Treat the data as a population. Complete parts (a) through (c). Temperature (°F) 50-59 60-69 70-79 80-89 90-99 100-109 Days 315 1452 1519 267 (a) Approximate the mean and standard deviation for temperature...
 Those questions are for the same question, please answer all of
them. Thanks~
eBook Each year America.EDU ranks the best paying college degrees In America. The followlng data show the medlan starting salary, the mld-career salary, and the percentage Increase from starting salary to mld career salary for the 20 college degrees with the highest mid-career salary (America.EDU website, August 29, 2013) Click on the datafile logo to reference the data DATA file Starting Salary Mid-Career Salary %Increase Aerospace engineering...
Those questions are for the same question, please answer all of
them. Thanks~
eBook Each year America.EDU ranks the best paying college degrees In America. The followlng data show the medlan starting salary, the mld-career salary, and the percentage Increase from starting salary to mld career salary for the 20 college degrees with the highest mid-career salary (America.EDU website, August 29, 2013) Click on the datafile logo to reference the data DATA file Starting Salary Mid-Career Salary %Increase Aerospace engineering...
 2.9 Question Help The table available below is the frequency distribution for data of the pulse rates (beats per minute) of males. Use the frequency distribution to construct a histogram Use class midpoint values for the horizontal scale. Do the pulse rates of males appear to have a normal distribution? EB Click the icon to view the frequency distribution of the pulse rates of males. Which histogram below shows the data? O A 45 54.5 645 74.5 84.5 94.5 104.5...
 In Exercises 29–32, find the mean of the data summarized in the frequency distribution. Also, compare the computed means to the actual means obtained by using the original list of data values, which are as follows: (Exercise 29) 36.2 years; (Exercise 30) 44.1 years; (Exercise 31) 224.3: (Exercise 32) 255.1. 30. 29. Frequency Age (yr) of Best Actress When Oscar Was Won 20-29 28 30-39 Frequency 29 34 14 3 5 Age (yr) of Best Actor When Oscar Was Won...
 1) a) The following distribution shows the number of cars sold each month by a garage over a period of 3 years: 8 9 10 11 12 13 14 15 Number of cars (x) Number of months (f) 1 4 5 8 5 4 5 4 State whether the variable measured is continuous or discrete and find the mode, the mean and the median. (6 marks) b) The weight (in kg) of 40 patients of the Berkshire Hospital are summarised...
 Construct the cumulative frequenoy distribution for the given data. Age (years) of Best Actress when award was won Frequency Age (years) of Best Actress when award was won Less than 30 Less than 40 Less than 50 Less than 60 Less than 70 Less than 80 Less than 90 Cumulative Frequency 20-29 30-39 40-49 50-59 60-69 70-79 80-89 29 36 14
Most questions answered within 3 hours.
-
A solution of iron (II) sulfate was prepared by dissolving
10.00g of FeSO4-7H20 (FW= 277.9) in...
asked 2 minutes ago -
There exists a haunted maze which contains n scare stations,
with a designated starting station s...
asked 8 minutes ago -
The heat of vaporization of benzene (C6H6)
is 30.77 kJ/mol at it's boiling point (80 C)....
asked 11 minutes ago -
3 (a) In a class with scores of
12 10 64 34 50 95 2 68...
asked 14 minutes ago -
A soap bubble with walls 382 nm thick floats in air.
Part A
If this bubble...
asked 16 minutes ago -
A study was conducted to determine the number of telephones each
of 100 households has. The...
asked 23 minutes ago -
How regret aversion bias can cause irrational decisions?
Mistakenly expect too much returns and underestimate the...
asked 25 minutes ago -
mutations in somatic cellsare transmitted from generation to
generation via gametes. True or False?
asked 25 minutes ago -
There are two identical, positively charged conducting spheres
fixed in space. The spheres are 39.4 cm...
asked 33 minutes ago -
It has been stated that the average life span of a man is 75
years. A...
asked 46 minutes ago -
At a certain harbor, the tides cause the ocean surface to rise
and fall a distance...
asked 44 minutes ago -
What is the molar volume that an ideal gas would occupy at
20.0°C and 1.50 atm?...
asked 48 minutes ago