

Homework Answers
|
Court Income=x |
Justice Salary=y |
|
|
|
|
|
|
|
64 |
29 |
-378.667 |
-15.222 |
5764.148 |
143388.444 |
231.716 |
|
|
406 |
46 |
-36.667 |
1.778 |
-65.185 |
1344.444 |
3.160 |
|
|
1566 |
91 |
1123.333 |
46.778 |
52547.037 |
1261877.778 |
2188.160 |
|
|
1130 |
56 |
687.333 |
11.778 |
8095.259 |
472427.111 |
138.716 |
|
|
272 |
45 |
-170.667 |
0.778 |
-132.741 |
29127.111 |
0.605 |
|
|
251 |
62 |
-191.667 |
17.778 |
-3407.407 |
36736.111 |
316.049 |
|
|
112 |
25 |
-330.667 |
-19.222 |
6356.148 |
109340.444 |
369.494 |
|
|
152 |
26 |
-290.667 |
-18.222 |
5296.593 |
84487.111 |
332.049 |
|
|
31 |
18 |
-411.667 |
-26.222 |
10794.815 |
169469.444 |
687.605 |
|
|
Total |
3984 |
398 |
0 |
0 |
85248.667 |
2308198 |
4267.556 |
|
Mean |
442.667 |
44.222 |


Answer(1):
The Null and alternative hypothesis to test the significance of correlation are
H0: ρ=0
H1: ρ≠0
Hence the correct option is A.
Answer(2):
The scatter plot of the given data is as below

Hence the correct option is A.
Answer(c):
The coefficient of correlation between two variables can be obtained by
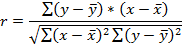
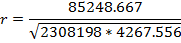


The linear correlation coefficient r is 0.859
Answer(d):
To check whether this correlation is significant or not we have to conduct a t-test for significance of correlation coefficient.
The test statistic to test this hypothesis is


The test statistic t is 4.438
Answer(e):
The p-value for above test is 0.003
Answer(f):
Because the p-value is less than the significance level 0.05, there is sufficient evidence to support the claim that there is linear correlation between court incomes and justice salaries for a significance level of α=0.05
Answer(g):
The correct option is
B. It does appear that justices might profit by levying larger fines.
Add Answer to:
Listed below are amounts of court income and salaries paid to the town justices. All amounts...
Listed below are amounts of court income and salaries paid to the town justices. All amounts...
 Listed below are amounts of court income and salaries paid to the town justices. All amounts are in thousands of dollars. Construct a scatterplot, find the value of the linear correlation coefficient r, and find the P-value using a 0.05. Is there sufficient evidence to conclude that there is a linear correlation between court incomes and justice salaries? Based on the results, does it appear that justices might profit by levying larger fines? 64.0 405.0 1566.01132.0 271.0 252.0 112.0 151.0...
Listed below are amounts of court income and salaries paid to the town justices. All amounts...
Listed below are amounts of court income and salaries paid to the town justices. All amounts are in thousands of dollars. Construct a scatterplot, find the value of the linear correlation coefficient r, and find the P-value using α=0.05. Is there sufficient evidence to conclude that there is a linear correlation between court incomes and justicesalaries? Based on the results, does it appear that justices might profit by levying larger fines? Court Income 66.0 405.0 1568.0 1130.0 272.0 251.0 110.0...
O Listed below are amounts of court income and salaries paid to the town justices. All...
 O Listed below are amounts of court income and salaries paid to the town justices. All amounts are in thousands of dollars. Construct a caterplot, find the value of the near correlation coefficient and find the value using a 05. Is there sufficient evidence to conclude that there is a linear correlation between court incomes and justice ses? Based on the results, or pear that justies might profit by levying larger fines? Court Income 604036 1568.0 1130.0 2710/2530 1120 150010...
Listed below are amounts of court income and salaries paid to the town justices. All amounts...
 Listed below are amounts of court income and salaries paid to the town justices. All amounts are in thousands of dollars. Construct a scatterplot, find the value of the linear correlation coefficient r, and find the P-value using a = 0.05. Is there sufficient evidence to conclude that there is a linear correlation between court incomes and justice salaries? Based on the results, does it appear that justices might profit by levying larger fines? Court Income 66.0 406.0 1567.0 1130.0...
2. Listed below are amounts of court income and salaries paid to the town justices. All...
 2. Listed below are amounts of court income and salaries paid to the town justices. All amounts are in thousands of dollars. Is there sufficient evidence to conclude that there is a linear correlation between court incomes and justice salaries? Use a significance level of a = 0.05. 66.0 405.0 1566.0 1130.0 273.0 251.0 112.0 153.0 33.0 Court Income Justice Salary 2944 18 90 56 48 611 STEP 1: CLAIM: STEP 2: 1. NULL HYPOTHESIS: Ho: 2. ALTERNATIVE HYPOTHESIS: Hi:...
The test statistic is...............(Round to two decimal places as needed.) The P-value is.......................(Round to three decimal...
 The test statistic is...............(Round to two decimal places
as needed.)
The P-value is.......................(Round to three decimal
places as needed.)
The test statistic t is ..................
(Round to three decimal places as needed.)
The P-value is.............................(Round to three
decimal places as needed.)
The P-value for this hypothesis test is
0.2300.230.
(Round to three decimal places as needed.)
Listed below are numbers of Internet users per 100 people and numbers of scientific award winners per 10 million people for different countries. Construct...
The test statistic is...............(Round to two decimal places
as needed.)
The P-value is.......................(Round to three decimal
places as needed.)
The test statistic t is ..................
(Round to three decimal places as needed.)
The P-value is.............................(Round to three
decimal places as needed.)
The P-value for this hypothesis test is
0.2300.230.
(Round to three decimal places as needed.)
Listed below are numbers of Internet users per 100 people and numbers of scientific award winners per 10 million people for different countries. Construct...
Uisted below are amounts of court income and salaries paid to the tewn ustioes All amounts are in...
 Uisted below are amounts of court income and salaries paid to the tewn ustioes All amounts are in uficent evidence to condude that there is a inear conelaion beween court incomes and jualice salaies7 Based on the los appear that justioes might geit by levying lage s Round to thee decimal places as eed The test saistic tin 4853 Round o tree deimal places as needed needed) than the signficance vel 0 05, here Hard to teee deond places ficent...
led bow we mounts of court income and sales paid to the town ces All mounts...
 led bow we mounts of court income and sales paid to the town ces All mounts are thousands of stars Construct a caterplot find the value of the linear comelton cost and find the Peninga-005. Is there are evidence conclude that there is a linea con between coutcomes and Based on the results, does it opear that profit by loving larger ines? Court income 64005156661131027301100158 0330 Justice Salary Ho po Оe to P0 Hy pro Hypo ODH plo HO Constructor...
Listed below are annual data for various years. The data are weights (metric tons) of imported...
 Listed below are annual data for various years. The data are weights (metric tons) of imported lemons and car crash fatality rates per 100,000 population. Construct a scatterplot, find the value of the linear correlation coefficient r, and find the P-value using a = 0.05. Is there sufficient evidence to conclude that there is a linear correlation between lemon imports and crash fatality rates? Do the results suggest that imported lemons cause car fatalities? Lemon Imports 232 265 357 483...
Listed below are annual data for various years. The data are weights (metric tons) of imported...
 Listed below are annual data for various years. The data are weights (metric tons) of imported lemons and car crash fatality rates per 100,000 population. Construct a scatterplot, find the value of the linear correlation coefficient r, and find the P-value using a = 0.05. Is there sufficient evidence to conclude that there is a linear correlation between lemon imports and crash fatality rates? Do the results suggest that imported lemons cause car fatalities? Lemon Imports 230 266 358 482...
 Listed below are amounts of court income and salaries paid to the town justices. All amounts are in thousands of dollars. Construct a scatterplot, find the value of the linear correlation coefficient r, and find the P-value using a 0.05. Is there sufficient evidence to conclude that there is a linear correlation between court incomes and justice salaries? Based on the results, does it appear that justices might profit by levying larger fines? 64.0 405.0 1566.01132.0 271.0 252.0 112.0 151.0...
 O Listed below are amounts of court income and salaries paid to the town justices. All amounts are in thousands of dollars. Construct a caterplot, find the value of the near correlation coefficient and find the value using a 05. Is there sufficient evidence to conclude that there is a linear correlation between court incomes and justice ses? Based on the results, or pear that justies might profit by levying larger fines? Court Income 604036 1568.0 1130.0 2710/2530 1120 150010...
 Listed below are amounts of court income and salaries paid to the town justices. All amounts are in thousands of dollars. Construct a scatterplot, find the value of the linear correlation coefficient r, and find the P-value using a = 0.05. Is there sufficient evidence to conclude that there is a linear correlation between court incomes and justice salaries? Based on the results, does it appear that justices might profit by levying larger fines? Court Income 66.0 406.0 1567.0 1130.0...
 2. Listed below are amounts of court income and salaries paid to the town justices. All amounts are in thousands of dollars. Is there sufficient evidence to conclude that there is a linear correlation between court incomes and justice salaries? Use a significance level of a = 0.05. 66.0 405.0 1566.0 1130.0 273.0 251.0 112.0 153.0 33.0 Court Income Justice Salary 2944 18 90 56 48 611 STEP 1: CLAIM: STEP 2: 1. NULL HYPOTHESIS: Ho: 2. ALTERNATIVE HYPOTHESIS: Hi:...
 The test statistic is...............(Round to two decimal places
as needed.)
The P-value is.......................(Round to three decimal
places as needed.)
The test statistic t is ..................
(Round to three decimal places as needed.)
The P-value is.............................(Round to three
decimal places as needed.)
The P-value for this hypothesis test is
0.2300.230.
(Round to three decimal places as needed.)
Listed below are numbers of Internet users per 100 people and numbers of scientific award winners per 10 million people for different countries. Construct...
The test statistic is...............(Round to two decimal places
as needed.)
The P-value is.......................(Round to three decimal
places as needed.)
The test statistic t is ..................
(Round to three decimal places as needed.)
The P-value is.............................(Round to three
decimal places as needed.)
The P-value for this hypothesis test is
0.2300.230.
(Round to three decimal places as needed.)
Listed below are numbers of Internet users per 100 people and numbers of scientific award winners per 10 million people for different countries. Construct...
 Uisted below are amounts of court income and salaries paid to the tewn ustioes All amounts are in uficent evidence to condude that there is a inear conelaion beween court incomes and jualice salaies7 Based on the los appear that justioes might geit by levying lage s Round to thee decimal places as eed The test saistic tin 4853 Round o tree deimal places as needed needed) than the signficance vel 0 05, here Hard to teee deond places ficent...
 led bow we mounts of court income and sales paid to the town ces All mounts are thousands of stars Construct a caterplot find the value of the linear comelton cost and find the Peninga-005. Is there are evidence conclude that there is a linea con between coutcomes and Based on the results, does it opear that profit by loving larger ines? Court income 64005156661131027301100158 0330 Justice Salary Ho po Оe to P0 Hy pro Hypo ODH plo HO Constructor...
 Listed below are annual data for various years. The data are weights (metric tons) of imported lemons and car crash fatality rates per 100,000 population. Construct a scatterplot, find the value of the linear correlation coefficient r, and find the P-value using a = 0.05. Is there sufficient evidence to conclude that there is a linear correlation between lemon imports and crash fatality rates? Do the results suggest that imported lemons cause car fatalities? Lemon Imports 232 265 357 483...
 Listed below are annual data for various years. The data are weights (metric tons) of imported lemons and car crash fatality rates per 100,000 population. Construct a scatterplot, find the value of the linear correlation coefficient r, and find the P-value using a = 0.05. Is there sufficient evidence to conclude that there is a linear correlation between lemon imports and crash fatality rates? Do the results suggest that imported lemons cause car fatalities? Lemon Imports 230 266 358 482...
Most questions answered within 3 hours.
-
explain and comment out your answer
43. How many address lines are required to address a...
asked 3 minutes ago -
A sample of 45 observations is selected from a normal
population. The sample mean is 49,...
asked 18 minutes ago -
A construction company is planning to bid on a building
contract. The bid costs the company...
asked 15 minutes ago -
A firm operating in a purely competitive environment is faced
with a market price of $250....
asked 22 minutes ago -
•Let’s say someone claims the average population size is
600 feet squared and the housing authority...
asked 30 minutes ago -
Cynaide is a deadly poison that blocks the last step in the
electron transport chain of...
asked 34 minutes ago -
Your friend tells you that there is a vending machine on campus
that dispenses M&M packs...
asked 49 minutes ago -
What advantages are there to using piperidine rather than
hydroxide as a base?
asked 47 minutes ago -
7. The life of a Freeze Breeze electric fan is normally
distributed with a mean 4...
asked 50 minutes ago -
1. A 751 mL NaCl solution is diluted to a volume of 1.06 L and a...
asked 55 minutes ago -
8
A $20,000 face value STRIPS is currently quoted at 38.642 and
has 8 years to...
asked 56 minutes ago -
The current exchange rate between the Japanese yen and
the US dollar is 120 yen per...
asked 58 minutes ago