
|
n |
α=0.05 |
α=0.01 |
NOTE: To test
H0: ρ=0 againstH1: ρ≠0, rejectH0 if the absolute value of r is greater than the critical value in the table. |
|---|---|---|---|
|
4 |
0.950 |
0.990 |
|
|
5 |
0.878 |
0.959 |
|
|
6 |
0.811 |
0.917 |
|
|
7 |
0.754 |
0.875 |
|
|
8 |
0.707 |
0.834 |
|
|
9 |
0.666 |
0.798 |
|
|
10 |
0.632 |
0.765 |
|
|
11 |
0.602 |
0.735 |
|
|
12 |
0.576 |
0.708 |
|
|
13 |
0.553 |
0.684 |
|
|
14 |
0.532 |
0.661 |
|
|
15 |
0.514 |
0.641 |
|
|
16 |
0.497 |
0.623 |
|
|
17 |
0.482 |
0.606 |
|
|
18 |
0.468 |
0.590 |
|
|
19 |
0.456 |
0.575 |
|
|
20 |
0.444 |
0.561 |
|
|
25 |
0.396 |
0.505 |
|
|
30 |
0.361 |
0.463 |
|
|
35 |
0.335 |
0.430 |
|
|
40 |
0.312 |
0.402 |
|
|
45 |
0.294 |
0.378 |
|
|
50 |
0.279 |
0.361 |
|
|
60 |
0.254 |
0.330 |
|
|
70 |
0.236 |
0.305 |
|
|
80 |
0.220 |
0.286 |
|
|
90 |
0.207 |
0.269 |
|
|
100 |
0.196 |
0.256 |
|
|
n |
α=0.05 |
α=0.01 |
Homework Answers
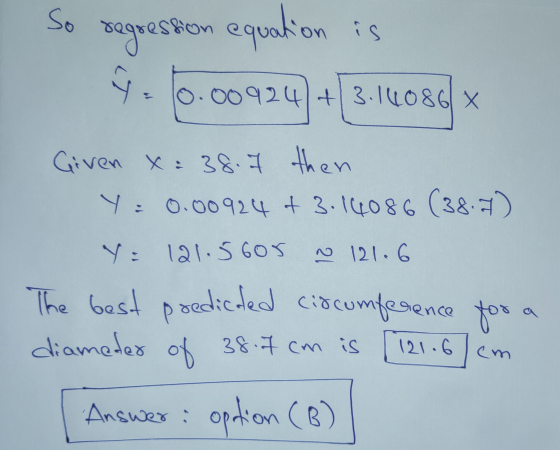
For the given data using Regression in Excel we get output as
| SUMMARY OUTPUT | ||||||
| Regression Statistics | ||||||
| Multiple R | 0.9999996 | |||||
| R Square | 0.9999992 | |||||
| Adjusted R Square | 0.99999904 | |||||
| Standard Error | 0.027980746 | |||||
| Observations | 7 | |||||
| ANOVA | ||||||
| df | SS | MS | F | Significance F | ||
| Regression | 1 | 4894.513228 | 4894.513 | 6251596 | 1.94234E-16 | |
| Residual | 5 | 0.003914611 | 0.000783 | |||
| Total | 6 | 4894.517143 | ||||
| Coefficients | Standard Error | t Stat | P-value | Lower 95% | Upper 95% | |
| Intercept | 0.00923744 | 0.019260396 | 0.479608 | 0.65175 | -0.040272985 | 0.058747866 |
| x | 3.140862184 | 0.001256184 | 2500.319 | 1.94E-16 | 3.137633059 | 3.144091309 |
From the above output
Add Answer to:
Critical Values of the Pearson Correlation Coefficient
r
n
α=0.05
α=0.01
NOTE: To test
H0:
ρ=0...
n α=0.05 α=0.01 NOTE: To test H0: ρ=0 against H1: ρ≠0, reject H0 if the absolute...
 n
α=0.05
α=0.01
NOTE: To test
H0:
ρ=0
against
H1:
ρ≠0,
reject
H0
if the absolute value of r is greater than the critical value in
the table.
4
0.950
0.990
5
0.878
0.959
6
0.811
0.917
7
0.754
0.875
8
0.707
0.834
9
0.666
0.798
10
0.632
0.765
11
0.602
0.735
12
0.576
0.708
13
0.553
0.684
14
0.532
0.661
15
0.514
0.641
16
0.497
0.623
17
0.482
0.606
18
0.468
0.590
19
0.456
0.575
20
0.444
0.561
25...
n
α=0.05
α=0.01
NOTE: To test
H0:
ρ=0
against
H1:
ρ≠0,
reject
H0
if the absolute value of r is greater than the critical value in
the table.
4
0.950
0.990
5
0.878
0.959
6
0.811
0.917
7
0.754
0.875
8
0.707
0.834
9
0.666
0.798
10
0.632
0.765
11
0.602
0.735
12
0.576
0.708
13
0.553
0.684
14
0.532
0.661
15
0.514
0.641
16
0.497
0.623
17
0.482
0.606
18
0.468
0.590
19
0.456
0.575
20
0.444
0.561
25...
Find the regression equation, letting the diameter be the predictor (x) variable. Find the best predicted...
Find the regression equation, letting the diameter be the predictor (x) variable. Find the best predicted circumference of a marblemarble with a diameter of 1.7 cm. How does the result compare to the actual circumference of 5.3 cm? Use a significance level of 0.05 _ Diameter Circumference Baseball 7.4 23.2 Basketball 24.4 76.7 Golf 4.2 13.2 Soccer 21.9 68.8 Tennis 7.0 22.0 Ping-Pong 4.0 12.6 Volleyball 20.9 65.7 The regression equation is ModifyingAbove y with caretyequals=nothingplus+nothingx. (Round to five decimal...
Find the regression equation, letting the diameter be the predictor (x) variable. Find the best predicted...
Find the regression equation, letting the diameter be the predictor (x) variable. Find the best predicted circumference of a beachball with a diameter of 44.6 cm. How does the result compare to the actual circumference of 140.1 cm? Use a significance level of 0.05. Find the regression equation, letting the diameter be the predictor (x) variable. Find the best predicted circumference of a beachball with a diameter of 44.6 cm. How does the result compare to the actual circumference of...
please answer all parts 1 Critical Values of the Pearson Correlation Coefficient Critical Values of the...
 please answer all parts
1 Critical Values of the Pearson Correlation Coefficient Critical Values of the Pearson Correlation coefficient a = 0.05 a = 0.01 0.950 10.990 0.878 0.959 0.811 0.917 0.754 0.875 0.707 0.834 0.666 10.798 0.632 0.765 0.602 0.735 0.576 0.708 0.553 0.684 0.532 0.661 0.514 0.641 0.497 0.623 0.482 0.606 0.468 10.590 0.456 0.575 0.444 0.561 0.396 0.505 10.361 10.463 sand Print Done 17 18 19 0.402 0.468 0.590 0.456 10.575 0.444 0.561 0.396 0.505 0.361 0.463...
please answer all parts
1 Critical Values of the Pearson Correlation Coefficient Critical Values of the Pearson Correlation coefficient a = 0.05 a = 0.01 0.950 10.990 0.878 0.959 0.811 0.917 0.754 0.875 0.707 0.834 0.666 10.798 0.632 0.765 0.602 0.735 0.576 0.708 0.553 0.684 0.532 0.661 0.514 0.641 0.497 0.623 0.482 0.606 0.468 10.590 0.456 0.575 0.444 0.561 0.396 0.505 10.361 10.463 sand Print Done 17 18 19 0.402 0.468 0.590 0.456 10.575 0.444 0.561 0.396 0.505 0.361 0.463...
Find the regression equation letting overhead with be the predictor(s) variable. Find the best predicted weight...
 Find the regression equation letting overhead with be the predictor(s) variable. Find the best predicted weight of a seal the overhead width moured from a photograph is 16 cm. Can the prediction be correct? What is wrong with predicting the weight in this case? Use a significance level of 0.05. Overhead Width (cm) 84 79 82 7.8 Weight (kg) 201 209 190 181 200 Click the loon to view the critical values of the Pearson correlation coeficient The regression equation...
 n
α=0.05
α=0.01
NOTE: To test
H0:
ρ=0
against
H1:
ρ≠0,
reject
H0
if the absolute value of r is greater than the critical value in
the table.
4
0.950
0.990
5
0.878
0.959
6
0.811
0.917
7
0.754
0.875
8
0.707
0.834
9
0.666
0.798
10
0.632
0.765
11
0.602
0.735
12
0.576
0.708
13
0.553
0.684
14
0.532
0.661
15
0.514
0.641
16
0.497
0.623
17
0.482
0.606
18
0.468
0.590
19
0.456
0.575
20
0.444
0.561
25...
n
α=0.05
α=0.01
NOTE: To test
H0:
ρ=0
against
H1:
ρ≠0,
reject
H0
if the absolute value of r is greater than the critical value in
the table.
4
0.950
0.990
5
0.878
0.959
6
0.811
0.917
7
0.754
0.875
8
0.707
0.834
9
0.666
0.798
10
0.632
0.765
11
0.602
0.735
12
0.576
0.708
13
0.553
0.684
14
0.532
0.661
15
0.514
0.641
16
0.497
0.623
17
0.482
0.606
18
0.468
0.590
19
0.456
0.575
20
0.444
0.561
25...
 please answer all parts
1 Critical Values of the Pearson Correlation Coefficient Critical Values of the Pearson Correlation coefficient a = 0.05 a = 0.01 0.950 10.990 0.878 0.959 0.811 0.917 0.754 0.875 0.707 0.834 0.666 10.798 0.632 0.765 0.602 0.735 0.576 0.708 0.553 0.684 0.532 0.661 0.514 0.641 0.497 0.623 0.482 0.606 0.468 10.590 0.456 0.575 0.444 0.561 0.396 0.505 10.361 10.463 sand Print Done 17 18 19 0.402 0.468 0.590 0.456 10.575 0.444 0.561 0.396 0.505 0.361 0.463...
please answer all parts
1 Critical Values of the Pearson Correlation Coefficient Critical Values of the Pearson Correlation coefficient a = 0.05 a = 0.01 0.950 10.990 0.878 0.959 0.811 0.917 0.754 0.875 0.707 0.834 0.666 10.798 0.632 0.765 0.602 0.735 0.576 0.708 0.553 0.684 0.532 0.661 0.514 0.641 0.497 0.623 0.482 0.606 0.468 10.590 0.456 0.575 0.444 0.561 0.396 0.505 10.361 10.463 sand Print Done 17 18 19 0.402 0.468 0.590 0.456 10.575 0.444 0.561 0.396 0.505 0.361 0.463...
 Find the regression equation letting overhead with be the predictor(s) variable. Find the best predicted weight of a seal the overhead width moured from a photograph is 16 cm. Can the prediction be correct? What is wrong with predicting the weight in this case? Use a significance level of 0.05. Overhead Width (cm) 84 79 82 7.8 Weight (kg) 201 209 190 181 200 Click the loon to view the critical values of the Pearson correlation coeficient The regression equation...
Most questions answered within 3 hours.
-
Problem: Patient Fees C++
You are to write a program that computes a patient’s bill for...
asked 1 hour ago -
In a population of interest, we know that, 77% drink coffee, and
23% drink tea. Assume...
asked 1 hour ago -
Given that f(x) = e-(x-1) for x > 1, determine the following
probabilities:
a) P(X <...
asked 1 hour ago -
A mechanic pushes a 2.60 ✕ 103-kg car from rest to a speed of v,
doing...
asked 1 hour ago -
International information systems result in all of the following
except:
A. improved quality of information flow....
asked 1 hour ago -
The president of the retailer Prime Products has just approached
the company’s bank with a request...
asked 1 hour ago -
If the carrying amount is $200,000 and recoverable amount is
$205000, the impairment amount is:
Select...
asked 1 hour ago -
The correlation is inappropriate as a measure of association
between two quantitative variables (you may select...
asked 1 hour ago -
USE THE DATA IN THE TABLE BELOW TO ANSWER QUESTIONS 19 – 24
(Assume all account...
asked 1 hour ago -
Mahaley, Inc., manufactures and sells two products: Product Q9
and Product F0. Data concerning the expected...
asked 1 hour ago -
To measure the current through one branch of a parallel circuit,
the meter is connected ________....
asked 2 hours ago -
a)
The following table shows the profile, by the math section of
the SAT Reasoning Test,...
asked 2 hours ago