Barbara and James are in two separate classes taught by Mrs. Oshinsky. In Barbara’s class, the...
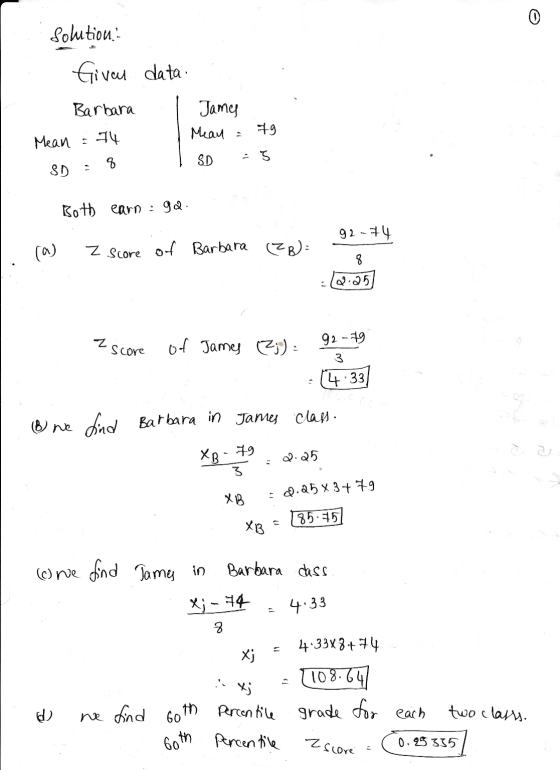
Barbara and James are in two separate classes taught by Mrs. Oshinsky. In Barbara’s class, the mean grade on a poetry test is a 74 and the standard deviation is 8. In James’s class, the mean grade is a 79 and the standard deviation is 3. Barbara and James both earn a 92 on their tests.
(A) Which student performed better in comparison to his or her class? You must show calculations to justify your response, or no credit will be given.
(B) In James’s class, what grade is comparable to Barbara’s?
(C) In Barbara’s class, what grade is comparable to James’s?
(D) What is the 60th percentile grade for each of the two classes?
Is it possible if you could write down each equation used next to each step? Its helpful for me to see what is being used and why. Also is this type of question a binomial, geometric, hypergeometric, Poisson, normal, or a standard normal and how could I identify it in the future?
Homework Answers

Add Answer to:
Barbara and James are in two separate classes taught by Mrs.
Oshinsky. In Barbara’s class, the...
Barbara and James are in two separate classes taught by Mrs. Oshinsky. In Barbara’s class, the...
Barbara and James are in two separate classes taught by Mrs. Oshinsky. In Barbara’s class, the mean grade on a poetry test is a 74 and the standard deviation is 8. In James’s class, the mean grade is a 79 and the standard deviation is 3. Barbara and James both earn a 92 on their tests. (A) Which student performed better in comparison to his or her class? You must show calculations to justify your response, or no credit will...
In a family with 6 children, let success be defined as having a baby girl, and...
In a family with 6 children, let success be defined as having a baby girl, and find the probability that: (A) the first girl is the first child born. (B) the first girl is the 2nd or the 4th child born. (C) the first girl is the last child born. (D) there are no girls born into this family. Is it possible if you could write down each equation used next to each step? Its helpful for me to see...
n a family with 6 children, let success be defined as having a baby girl, and...
n a family with 6 children, let success be defined as having a baby girl, and find the probability that: (A) the first girl is the first child born. (B) the first girl is the 2nd or the 4th child born. (C) the first girl is the last child born. (D) there are no girls born into this family. Is it possible if you could write down each equation used next to each step? Its helpful for me to see...
Can I get the normal graph explanation to this question, NOT USING EXCEL. yto All DATE...
 Can I get the normal graph explanation to this question,
NOT USING EXCEL.
yto All DATE & TIME 1/17/20 Forward Recipients Mess PROBLEM 4 The grades on the midterm examination given in a large managerial statistics class are normally distributed with mean 75 and standard deviation 9. The instructor of this class u must use normal graphs from our notes to solve these problems. wants to assign an A grade to the top 10% of the scores, a B grade...
Can I get the normal graph explanation to this question,
NOT USING EXCEL.
yto All DATE & TIME 1/17/20 Forward Recipients Mess PROBLEM 4 The grades on the midterm examination given in a large managerial statistics class are normally distributed with mean 75 and standard deviation 9. The instructor of this class u must use normal graphs from our notes to solve these problems. wants to assign an A grade to the top 10% of the scores, a B grade...
Computing Z scores A teacher wanted to know how well the gifted students in here class...
Computing Z scores A teacher wanted to know how well the gifted students in here class perform relative to her other classes. She administers a standardized test with a mean of 50 and standard deviation of 10. Her class of 31 students has an average score of 55, what percent of classes is their average score higher than? 2. A researcher wanted to study the effects of mentoring on intelligence scores. He wanted to know as a baseline what the...
a. Ms. Newell gave her class a 10-question multiple-choice quiz with 4 choices. Let X =...
a. Ms. Newell gave her class a 10-question multiple-choice quiz with 4 choices. Let X = the number of questions that a randomly selected student in the class answered correctly. The mean and standard deviation of X are 7.6 and 1.32 respectively. To determine each student’s grade on the quiz, Ms. Newell will multiply his or her number of correct answers by 10. Let RV ‘G’ be the grade of a randomly chosen student in the class. i. Calculate the...
1. Ms. Jackson has three sections of the course "Introduction to Statistics.” The midterm results reveal...
 1. Ms. Jackson has three sections of the course "Introduction to Statistics.” The midterm results reveal that class A has an average of 82, class B has an average of 88, and class C has an average of 92. If there were 20 students in class A, 25 students in class B, and 27 students in class C, what is the combined mean (the average for all the three classes)? Show your work. 2. In your Biology class, your final...
Narrative: Classes 1 and 2 Suppose a 95% confidence interval for between Class 1 and Class...
 Narrative: Classes 1 and 2 Suppose a 95% confidence interval for between Class 1 and Class 2 (in that These results were based on independent sample class. confidence interval for the difference in test scores nd Class 2 (in that order) is the following: 9+/- 2. ependent samples of size 100 from each 17. Classes 1 and 2 narrative) What can you conci ou are confident that the averages for Class 1 and Class 2 are significantly different b. You...
Given a parameterization and some assumptions about the underlying distribution, there are two possible approaches to...
Given a parameterization and some assumptions about the underlying distribution, there are two possible approaches to approximating a solution to the problem. 1) We could generate a single sample of size N from the distribution and do M bootstrap samples. (Method 1). This basically mirrors real life. 2)We could generate M samples of size N directly from the distribution. (Method 2). This basically mirrors what we would like to do in real life. Compare these approaches with the following problem:...
The professor of a introductory calculus class has stated that, historically, the distribution of final exam...
 The professor of a
introductory calculus class has stated that, historically, the
distribution of final exam grades in the course resemble a Normal
distribution with a mean final exam mark of μ=63μ=63% and a
standard deviation of σ=9σ=9%.
If using/finding zz-values, use three decimals.
(a) What is the probability that a random chosen
final exam mark in this course will be at least 73%? Answer to four
decimals.
(b) In order to pass this course, a student must
have a...
The professor of a
introductory calculus class has stated that, historically, the
distribution of final exam grades in the course resemble a Normal
distribution with a mean final exam mark of μ=63μ=63% and a
standard deviation of σ=9σ=9%.
If using/finding zz-values, use three decimals.
(a) What is the probability that a random chosen
final exam mark in this course will be at least 73%? Answer to four
decimals.
(b) In order to pass this course, a student must
have a...
 Can I get the normal graph explanation to this question,
NOT USING EXCEL.
yto All DATE & TIME 1/17/20 Forward Recipients Mess PROBLEM 4 The grades on the midterm examination given in a large managerial statistics class are normally distributed with mean 75 and standard deviation 9. The instructor of this class u must use normal graphs from our notes to solve these problems. wants to assign an A grade to the top 10% of the scores, a B grade...
Can I get the normal graph explanation to this question,
NOT USING EXCEL.
yto All DATE & TIME 1/17/20 Forward Recipients Mess PROBLEM 4 The grades on the midterm examination given in a large managerial statistics class are normally distributed with mean 75 and standard deviation 9. The instructor of this class u must use normal graphs from our notes to solve these problems. wants to assign an A grade to the top 10% of the scores, a B grade...
 1. Ms. Jackson has three sections of the course "Introduction to Statistics.” The midterm results reveal that class A has an average of 82, class B has an average of 88, and class C has an average of 92. If there were 20 students in class A, 25 students in class B, and 27 students in class C, what is the combined mean (the average for all the three classes)? Show your work. 2. In your Biology class, your final...
 Narrative: Classes 1 and 2 Suppose a 95% confidence interval for between Class 1 and Class 2 (in that These results were based on independent sample class. confidence interval for the difference in test scores nd Class 2 (in that order) is the following: 9+/- 2. ependent samples of size 100 from each 17. Classes 1 and 2 narrative) What can you conci ou are confident that the averages for Class 1 and Class 2 are significantly different b. You...
 The professor of a
introductory calculus class has stated that, historically, the
distribution of final exam grades in the course resemble a Normal
distribution with a mean final exam mark of μ=63μ=63% and a
standard deviation of σ=9σ=9%.
If using/finding zz-values, use three decimals.
(a) What is the probability that a random chosen
final exam mark in this course will be at least 73%? Answer to four
decimals.
(b) In order to pass this course, a student must
have a...
The professor of a
introductory calculus class has stated that, historically, the
distribution of final exam grades in the course resemble a Normal
distribution with a mean final exam mark of μ=63μ=63% and a
standard deviation of σ=9σ=9%.
If using/finding zz-values, use three decimals.
(a) What is the probability that a random chosen
final exam mark in this course will be at least 73%? Answer to four
decimals.
(b) In order to pass this course, a student must
have a...
Most questions answered within 3 hours.
-
The average length of time between arrivals at a turnpike
toll-booth is 26 seconds. What is...
asked 28 minutes ago -
(a) A piston at 6.1 atm contains a gas that occupies a volume of
3.5 L....
asked 1 hour ago -
Please answer true or false. Words
cannot be changed or added in to make it true...
asked 1 hour ago -
An empty test tube weighs 15.923 grams. Then,
MgCl2•6H2O is added into the test tube. After...
asked 1 hour ago -
Assume memory access is 10 units of time and disk access is
10000 units of time....
asked 2 hours ago -
1. Are all good samples random?
2. Magazines often report surveys giving statistics such as “63%...
asked 2 hours ago -
Under all the various types of market structures, firms
must eventually earn some economic profits for...
asked 2 hours ago -
Consider the following fitness regime for a single locus trait
with two co-dominant alleles: w11 =...
asked 2 hours ago -
A large cable company reports the following.
80% of its customers subscribe to its cable TV...
asked 2 hours ago -
Please answer the question in brief.
Discuss the role of ERP in organizations. Are ERP tools...
asked 2 hours ago -
Discuss the pros and cons of collaborative software such
as SameTime. Does it increase productivity? What...
asked 2 hours ago -
Buying your in-laws a gift because it’s expected is
due to the ____________ motive of gift-giving....
asked 2 hours ago