


Homework Answers
The statistical software output for this problem is :
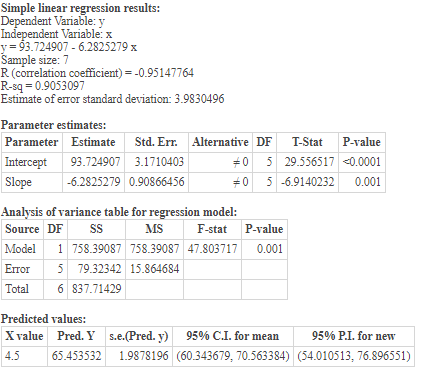
Step - 1) Slope = -6.283
Step - 2) Y-intercept = 93.725
Step - 3) b0
Step - 4) false
Step - 5) Estimated value = 65.454
Step - 6) the coefficient of determination = 0.905
Add Answer to:
The table below gives the number of hours spent unsupervised each day as well as the...
The table below gives the number of hours spent unsupervised each day as well as the...
 The table below gives the number of hours spent unsupervised each day as well as the overall grade averages for seven randomly selected middle school students. Using this data, consider the equation of the regression line.ỹ = bo + bx for predicting the overall grade average for a middle school student based on the number of hours spent unsupervised each day. Keep in mind, the correlation coefficient may or may not be statistically significant for the data given. Remember, in...
The table below gives the number of hours spent unsupervised each day as well as the...
 The table below gives the number of hours spent unsupervised each day as well as the overall grade averages for seven randomly selected middle school students. Using this data, consider the equation of the regression line, 9 = bi + bx, for predicting the overall grade average for a middle school student based on the number of hours spent unsupervised each day, Keep in mind, the correlation coefficient may or may not be statistically significant for the data given. Remember,...
The table below gives the number of hours spent unsupervised each day as well as the...
 The table below gives the number of hours spent unsupervised each day as well as the overall grade averages for seven randomly selected middle school students. Using this data, consider the equation of the regression line, y - bo t bix. for predicting the overall grade average for a middle school student based on the number of hours spent unsupervised each day Keep in mind, the correlation coefficient may or may not be statistically significant for the data given. Remember,...
The table below gives the number of hours spent unsupervised each day as well as the...
 The table below gives the number of hours spent unsupervised each day as well as the overall grade averages for seven randomly selected middle school students. Using this data, consider the equation of the regression line. 9 = b + b x. for predicting the overall grade average for a middle school student based on the number of hours spent unsupervised each day. Keep in mind, the correlation coefficient may or may not be statistically significant for the data given....
The table below gives the number of hours spent unsupervised each day as well as the...
The table below gives the number of hours spent unsupervised each day as well as the overall grade averages for seven randomly selected middle school students. Using this data, consider the equation of the regression line. y = b0 + b1x. for predicting the overall grade average for a middle school student based on the number of hours spent unsupervised each day. Keep in mind, the correlation coefficient may or may not be statistically significant for the data given. Remember,...
The table below gives the number of hours spent unsupervised each day as well as the...
The table below gives the number of hours spent unsupervised each day as well as the overall grade averages for seven randomly selected middle school students. Using this data, consider the equation of the regression line, yˆ=b0+b1xy^=b0+b1x, for predicting the overall grade average for a middle school student based on the number of hours spent unsupervised each day. Keep in mind, the correlation coefficient may or may not be statistically significant for the data given. Remember, in practice, it would...
The table below gives the number of hours spent unsupervised each day as well as the...
The table below gives the number of hours spent unsupervised each day as well as the overall grade averages for seven randomly selected middle school students. Using this data, consider the equation of the regression line, y =b0 + b1x for predicting the overall grade average for a middle school student based on the number of hours spent unsupervised each day. Keep in mind, the correlation coefficient may or may not be statistically significant for the data given. Remember, in...
The table below gives the number of hours spent unsupervised each day as well as the...
The table below gives the number of hours spent unsupervised each day as well as the overall grade averages for seven randomly selected middle school students. Using this data, consider the equation of the regression line, yˆ=b0+b1x, for predicting the overall grade average for a middle school student based on the number of hours spent unsupervised each day. Keep in mind, the correlation coefficient may or may not be statistically significant for the data given. Remember, in practice, it would...
The table below gives the number of hours spent unsupervised each day as well as the...
The table below gives the number of hours spent unsupervised each day as well as the overall grade averages for seven randomly selected middle school students. Using this data, consider the equation of the regression line, yˆ=b0+b1xy^=b0+b1x, for predicting the overall grade average for a middle school student based on the number of hours spent unsupervised each day. Keep in mind, the correlation coefficient may or may not be statistically significant for the data given. Remember, in practice, it would...
The table below gives the number of hours spent unsupervised each day as well as the...
The table below gives the number of hours spent unsupervised each day as well as the overall grade averages for seven randomly selected middle school students. Using this data, consider the equation of the regression line, yˆ=b0+b1xy^=b0+b1x, for predicting the overall grade average for a middle school student based on the number of hours spent unsupervised each day. Keep in mind, the correlation coefficient may or may not be statistically significant for the data given. Remember, in practice, it would...
 The table below gives the number of hours spent unsupervised each day as well as the overall grade averages for seven randomly selected middle school students. Using this data, consider the equation of the regression line.ỹ = bo + bx for predicting the overall grade average for a middle school student based on the number of hours spent unsupervised each day. Keep in mind, the correlation coefficient may or may not be statistically significant for the data given. Remember, in...
 The table below gives the number of hours spent unsupervised each day as well as the overall grade averages for seven randomly selected middle school students. Using this data, consider the equation of the regression line, 9 = bi + bx, for predicting the overall grade average for a middle school student based on the number of hours spent unsupervised each day, Keep in mind, the correlation coefficient may or may not be statistically significant for the data given. Remember,...
 The table below gives the number of hours spent unsupervised each day as well as the overall grade averages for seven randomly selected middle school students. Using this data, consider the equation of the regression line, y - bo t bix. for predicting the overall grade average for a middle school student based on the number of hours spent unsupervised each day Keep in mind, the correlation coefficient may or may not be statistically significant for the data given. Remember,...
 The table below gives the number of hours spent unsupervised each day as well as the overall grade averages for seven randomly selected middle school students. Using this data, consider the equation of the regression line. 9 = b + b x. for predicting the overall grade average for a middle school student based on the number of hours spent unsupervised each day. Keep in mind, the correlation coefficient may or may not be statistically significant for the data given....
Most questions answered within 3 hours.
-
Living in a group could bring several disadvantages to an
individual. What are some of the...
asked 12 minutes ago -
Complete and balance the following reactions. In case of no
reaction occurring write NR.
Mix #1:...
asked 18 minutes ago -
If an economy consumes 75% of any increase in income, then an
increase in autonomous investment...
asked 21 minutes ago -
A shotputter throws the shot with an initial speed of 15.8 m/s
at a 38.0 ∘...
asked 37 minutes ago -
Debra and Merina sell electronic equipment and supplies through
their partnership. They wish to expand their...
asked 37 minutes ago -
How does a linear regression allow you to better estimate
trends, costs, and other factors in...
asked 45 minutes ago -
1. (15%) Describe the difference between a pull (Kanban), push
and CONWIP production systems.
asked 42 minutes ago -
QUESTION 5
The total area under the Z distribution curve is equal to:
a.
10
b....
asked 51 minutes ago -
Using Python
The variables x and y refer to numbers. Write a code segment
that prompts...
asked 1 hour ago -
If
the coefficient of static friction between a box and the floor is
0.35 with what...
asked 1 hour ago -
A die is designed to punch holes with a radius of 1.08 10-2 m in
a...
asked 1 hour ago -
government can increase import through
a. export subsidies
b. tax breaks
c. increase import tax
d....
asked 1 hour ago