STATISTICS HYPOTHESIS It appears that not all people are equally vulnerable to cancer. People from some...
STATISTICS HYPOTHESIS
It appears that not all people are equally vulnerable to cancer. People from some ethnic groups have higher or lower than average chances of developing certain types of cancer. Jennifer's manager Dr. Steinberg thinks that the company's insurance policy should reflect this fact and constantly raises this question in the meetings. To be more convincing, he asked Jennifer Nguyen to take a random sample of those Healthy Life
clients who belong to ethnic group X (at least on their maternal or paternal side) and a similar sample consisting of the clients without X ancestry. Then, Jennifer was asked to compare clients' Y parameters indicating likelihood of developing W cancer. (As the matter is ticklish, we will not be naming the ethnic group, the type of cancer, the medical parameter, and the gender of sample members.) Then, it is known that in the general population Y parameters are distributed with the standard deviation of 3.0 (therefore the population variance is equal to 9.0). However in the X ethnic group the population standard deviation is about 2.1(and the population variance is equal to 4.41). As only 2-3% of Canadians have X ancestors, Jennifer and her manager assume that the standard deviation in the population of those who have no X ancestry is also around 3.0 as in the country in general. This assumption allows using z-distribution. The data are provided. Can we state at 1% level of significance that it matters whether a person belongs to X group or not in terms of the risk of developing W cancer? Or the chances are equal (on average Y parameters are the same)? Help Jennifer Nguyen to conduct the test. Use Data Analysis z-Test: Two-Sample for Means. Note Data below
a) Describe the claim
b) Test Statistics
Critical Value
P-value
c) Decision
Data below
| Y-scores | ||
| X Group | Not X Group | |
| 1 | 9.2 | 2.6 |
| 2 | 6.4 | 4.7 |
| 3 | 5.5 | 8.8 |
| 4 | 7.1 | 2.0 |
| 5 | 3.6 | 1.2 |
| 6 | 5.3 | 3.5 |
| 7 | 6.5 | 5.2 |
| 8 | 9.8 | 6.8 |
| 9 | 2.5 | 9.1 |
| 10 | 4.9 | 1.0 |
| 11 | 9.5 | 0.8 |
| 12 | 7.7 | 0.9 |
| 13 | 8.1 | 1.6 |
| 14 | 6.0 | 4.5 |
| 15 | 5.0 | 5.6 |
| 16 | 5.5 | 7.5 |
| 17 | 7.2 | 2.8 |
| 18 | 4.5 | 2.0 |
| 19 | 4.0 | 1.9 |
| 20 | 4.8 | 1.8 |
| 21 | 8.5 | 8.5 |
| 22 | 6.6 | 7.4 |
| 23 | 7.1 | 8.0 |
| 24 | 3.6 | 9.5 |
| 25 | 4.7 | 2.4 |
| 26 | 6.2 | 0.9 |
| 27 | 9.1 | 1.4 |
| 28 | 5.5 | 8.3 |
| 29 | 5.9 | 5.0 |
| 30 | 6.0 | 7.7 |
| 31 | 7.1 | 9.2 |
| 32 | 4.0 | 1.6 |
| 33 | 5.0 | 4.5 |
| 34 | 5.5 | 5.5 |
| 35 | 7.2 | 7.5 |
| 36 | 4.5 | 2.9 |
| 37 | 6.2 | 2.0 |
| 38 | 9.2 | 1.9 |
| 39 | 5.5 | 2.1 |
| 40 | 5.8 | 8.7 |
Homework Answers


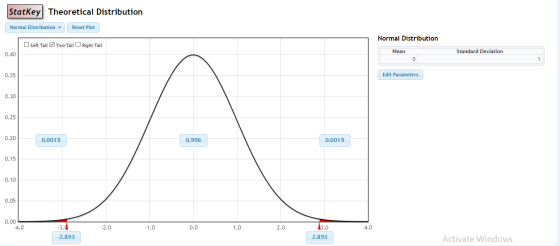
The test statistic is calculated using the formula mentioned. The critical value and the p value is obtained from STATKEY (images attached for reference). We compare the p value with alpha and make the required decision.
Add Answer to:
STATISTICS HYPOTHESIS
It appears that not all people are equally vulnerable to cancer.
People from some...
Below are four bivariate data sets and the scatter plot for each. (Note that each scatter...
Below are four bivariate data sets and the scatter plot for each. (Note that each scatter plot is displayed on the same scale.) Each data set is made up of sample values drawn from a population. x y 1.0 4.1 2.0 6.1 3.0 7.0 4.0 4.0 5.0 5.2 6.0 8.1 7.0 5.5 8.0 6.9 9.0 9.0 10.0 7.3 x1234567891011y12345678910110 Figure 1 u v 1.0 8.1 2.0 7.4 3.0 8.1 4.0 6.1 5.0 7.4 6.0 4.5 7.0 4.6 8.0 3.4...
Please use excel to solve. Any help would be greatly appreciated. A B E F G...
 Please use excel to solve. Any
help would be greatly appreciated.
A B E F G 1 C D Changes in Consumer Price Index, 1960-2006 (Percent) 2 Year-Year Percent Change in Commodities CPI Year-Year Percent Change in Services CPI 3 4 5 6 7 8 Commodities% 0.9 Services% 3.4 0.6 1.7 9 10 11 12 13 14 15 16 17 18 19 20 21 22 23 24 25 26 27 28 29 30 31 32 33 34 35 36 37...
Please use excel to solve. Any
help would be greatly appreciated.
A B E F G 1 C D Changes in Consumer Price Index, 1960-2006 (Percent) 2 Year-Year Percent Change in Commodities CPI Year-Year Percent Change in Services CPI 3 4 5 6 7 8 Commodities% 0.9 Services% 3.4 0.6 1.7 9 10 11 12 13 14 15 16 17 18 19 20 21 22 23 24 25 26 27 28 29 30 31 32 33 34 35 36 37...
4.3 Analysis Assignment #4 Note 1: all assignments moving forward must adhere to the appropriate Six Ste...
 4.3 Analysis Assignment #4 Note 1: all assignments moving forward must adhere to the appropriate Six Step Process (SSP). As our study materials have specified, the SSP has 3 versions. Version 1 is to be used for all t-tests; for all correlation analyses and Version 3 is be used for all regression analyses. Note 2: The data sets for Q1, Q2 and Q3 below can be downloaded here. Week 4 Analysis Assignments.xlsx Q1: (30 points) Complete the following data analysis:...
 Please use excel to solve. Any
help would be greatly appreciated.
A B E F G 1 C D Changes in Consumer Price Index, 1960-2006 (Percent) 2 Year-Year Percent Change in Commodities CPI Year-Year Percent Change in Services CPI 3 4 5 6 7 8 Commodities% 0.9 Services% 3.4 0.6 1.7 9 10 11 12 13 14 15 16 17 18 19 20 21 22 23 24 25 26 27 28 29 30 31 32 33 34 35 36 37...
Please use excel to solve. Any
help would be greatly appreciated.
A B E F G 1 C D Changes in Consumer Price Index, 1960-2006 (Percent) 2 Year-Year Percent Change in Commodities CPI Year-Year Percent Change in Services CPI 3 4 5 6 7 8 Commodities% 0.9 Services% 3.4 0.6 1.7 9 10 11 12 13 14 15 16 17 18 19 20 21 22 23 24 25 26 27 28 29 30 31 32 33 34 35 36 37...
 4.3 Analysis Assignment #4 Note 1: all assignments moving forward must adhere to the appropriate Six Step Process (SSP). As our study materials have specified, the SSP has 3 versions. Version 1 is to be used for all t-tests; for all correlation analyses and Version 3 is be used for all regression analyses. Note 2: The data sets for Q1, Q2 and Q3 below can be downloaded here. Week 4 Analysis Assignments.xlsx Q1: (30 points) Complete the following data analysis:...
Most questions answered within 3 hours.
-
Write a program to solve the Josephus problem, with the following
modification:
Sample Input:
./a.out n...
asked 2 hours ago -
At the start of a CD it is spinning at a rate of 525 rpm
(revolutions...
asked 2 hours ago -
4. Without doing any calculations, predict whether the observed
∆T would increase, decrease or remain the...
asked 4 hours ago -
Based on the range, which of the following sets of scores has
the greatest variability? 3,...
asked 5 hours ago -
Ripples in a pond travel at a velocity of 3 m/s with one peak
passing a...
asked 5 hours ago -
A man stands on the roof of a building of height 13.0 mm and
throws a...
asked 5 hours ago -
The extent to which assets are financed by borrowed funds and
other liabilities is indicated by:...
asked 6 hours ago -
Explain in detail
Germany is the fifth largest economy
explain what goods and services Germany specializes...
asked 6 hours ago -
The density of platinum is 21.45 g/mL. If a cube of platinum
with a mass of...
asked 6 hours ago -
Accounts Receivable
Sales
A/R Posting
Extended Sales Invoice
Packing Slip
Compare invoice to packing slip 2...
asked 6 hours ago -
Michaella, age 23, is a full-time law student and is claimed by
her parents as a...
asked 6 hours ago -
Why are polymers not typically casted into products?
asked 6 hours ago