The following data represent the number of days absent per year in a population of 6...
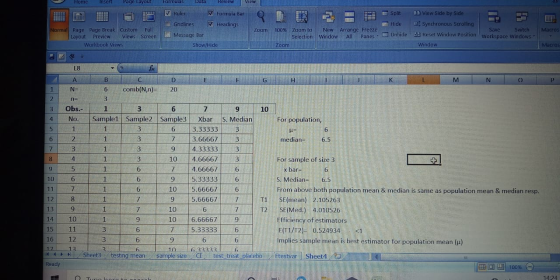
The following data represent the number of days absent per year in a population of 6 employees of a small company: 1 3 6 7 9 10
- Assuming that you sample without replacement, select all possible samples of size n = 3 and construct the sampling distribution of the sample mean and the sample median. Compute the mean of all sample means and all sample medians. Are they equal? What is this property?
- Which estimator, the sample mean or the sample median, would you use to estimate the population mean µ? Why? Justify statistically speaking your answer.
Homework Answers
,

Add Answer to:
The following data represent the number of days absent per year
in a population of 6...
Question 1 The following data represent the number of days absent per year in a population...
Question 1 The following data represent the number of days absent per year in a population of four employees of a small company: 1 3 6 7 Assuming that you sample without replacement, select all possible samples of n = 2 and construct the sampling distribution of the mean. Compare the mean of all the samples means and also compute the population mean. Are they equal? What is the property called? Repeat (a) for all the sampling distribution of the...
The following data represent the number of days absent per year in a population of six...
The following data represent the number of days absent per year in a population of six employees in a small company: 1 3 6 7 9 10 a. Compute the standard deviation of all the sample means. How does the standard deviation of the sample means and the population standard deviation compare?
Someone can help here explaining in an organized and easy way. Three randomly selected households are surveyed. The numbers of people in the households are 1, 4, and 10' Assume that samples of si...
 Someone can help here explaining in an organized and easy
way.
Three randomly selected households are surveyed. The numbers of people in the households are 1, 4, and 10' Assume that samples of size n 2 are randomly selected with replacement from the population of 1, 4, and 10. Construct a probability distribution table that describes the sampling distribution of the proportion of even numbers when samples o sizes n = 2 are randomly selected Does he mean o the...
Someone can help here explaining in an organized and easy
way.
Three randomly selected households are surveyed. The numbers of people in the households are 1, 4, and 10' Assume that samples of size n 2 are randomly selected with replacement from the population of 1, 4, and 10. Construct a probability distribution table that describes the sampling distribution of the proportion of even numbers when samples o sizes n = 2 are randomly selected Does he mean o the...
Question 1. Consider the following population data on weekly earnings after taxes of single- parent households...
 Question 1. Consider the following population data on weekly earnings after taxes of single- parent households in a small Ontario town. Weekly Index i Earnings 1220 1000 400 1400 i)Find the population average, variance and median weekly earnings. i) Construct a histogram with 3 equal length intervals for the population data ii) If samples of n-2 individuals were drawn without replacement from the population, how many distinct samples would be possible? Generate the possible samples of n-2 individuals drawn without...
A population consists of numbers 15, 9, 24, 6, and 18. 1. Draw all possible samples...
 A population consists of numbers 15, 9, 24, 6, and 18. 1. Draw all possible samples of size 3 with replacement from the given population. 2. Find mean of each sample 3. Construct sampling distribution of sample mean. 4. Verify that mean of all sample means is equal to population mean.
The data in the table represent the ages of the winners of an award for the...
 The data in the table represent the ages of the winners of an award for the past five years. Use the data to answer questions (a) through (). 61 45 25 61 56 (a) Compute the population mean, u. (b) Compute the mean for all C2 = 10 samples with size n=2. y Sample Sample Mean Sample Sample Mean 61.61 61,56 61.45 61.25 61,56 45,56 61,25 45,25 61,45 56,25 (c) Construct a sampling distribution for the mean by listing the...
Q1. In a population with N= 6 the values of yi are 8, 3, 1, 11,...
 Q1. In a population with N= 6 the values of yi are 8, 3, 1, 11, 4, and 7. Draw all possible ordered samples of size 2 from this population without replacement (i) Find the population mean (ii) Find P(s) for each sample point. (iii) Find T, for each unit. (iv)Find the sampling distribution of v (v) Show that is an unbiased estimator of F (vi) Show that V(F) (vii) Show that s 2 is an unbiased estimator of σ2
The data in the table represent the ages of the winners of an award for the...
 The data in the table represent the ages of the winners of an award for the past five years. Use the data to answer questions (a) through (e). 36 39 37 26 (a) Compute the population mean, . u (b) Compute the mean for all 5C, = 10 samples with size n = 2. Sample Mean Sample Sample Mean 50,39 50,36 50,37 50,26 39,36 Sample 39,37 39,26 36,37 36,26 37,26 (c) Construct a sampling distribution for the mean by listing...
The data in the table represent the ages of the winners of an award for the...
 The data in the table represent the ages of the winners of an award for the past five years. Use the data to answer questions (a) through (e). 52 52 51 59 41 (a) Compute the population mean, (b) Compute the mean for all C2 = 10 samples with size n = 2. Sample Sample Mean 52,59 52,52 52,41 52,51 59,52 Sample Sample Mean 59,41 59,51 52.41 52,51 41,51 (c) Construct a sampling distribution for the mean by listing the...
 Someone can help here explaining in an organized and easy
way.
Three randomly selected households are surveyed. The numbers of people in the households are 1, 4, and 10' Assume that samples of size n 2 are randomly selected with replacement from the population of 1, 4, and 10. Construct a probability distribution table that describes the sampling distribution of the proportion of even numbers when samples o sizes n = 2 are randomly selected Does he mean o the...
Someone can help here explaining in an organized and easy
way.
Three randomly selected households are surveyed. The numbers of people in the households are 1, 4, and 10' Assume that samples of size n 2 are randomly selected with replacement from the population of 1, 4, and 10. Construct a probability distribution table that describes the sampling distribution of the proportion of even numbers when samples o sizes n = 2 are randomly selected Does he mean o the...
 Question 1. Consider the following population data on weekly earnings after taxes of single- parent households in a small Ontario town. Weekly Index i Earnings 1220 1000 400 1400 i)Find the population average, variance and median weekly earnings. i) Construct a histogram with 3 equal length intervals for the population data ii) If samples of n-2 individuals were drawn without replacement from the population, how many distinct samples would be possible? Generate the possible samples of n-2 individuals drawn without...
 A population consists of numbers 15, 9, 24, 6, and 18. 1. Draw all possible samples of size 3 with replacement from the given population. 2. Find mean of each sample 3. Construct sampling distribution of sample mean. 4. Verify that mean of all sample means is equal to population mean.
 The data in the table represent the ages of the winners of an award for the past five years. Use the data to answer questions (a) through (). 61 45 25 61 56 (a) Compute the population mean, u. (b) Compute the mean for all C2 = 10 samples with size n=2. y Sample Sample Mean Sample Sample Mean 61.61 61,56 61.45 61.25 61,56 45,56 61,25 45,25 61,45 56,25 (c) Construct a sampling distribution for the mean by listing the...
 Q1. In a population with N= 6 the values of yi are 8, 3, 1, 11, 4, and 7. Draw all possible ordered samples of size 2 from this population without replacement (i) Find the population mean (ii) Find P(s) for each sample point. (iii) Find T, for each unit. (iv)Find the sampling distribution of v (v) Show that is an unbiased estimator of F (vi) Show that V(F) (vii) Show that s 2 is an unbiased estimator of σ2
 Q1. In a population with N= 6 the values of yi are 8, 3, 1, 11, 4, and 7. Draw all possible ordered samples of size 2 from this population without replacement (i) Find the population mean (ii) Find P(s) for each sample point. (iii) Find T, for each unit. (iv)Find the sampling distribution of v (v) Show that is an unbiased estimator of F (vi) Show that V(F) (vii) Show that s 2 is an unbiased estimator of σ2
 The data in the table represent the ages of the winners of an award for the past five years. Use the data to answer questions (a) through (e). 36 39 37 26 (a) Compute the population mean, . u (b) Compute the mean for all 5C, = 10 samples with size n = 2. Sample Mean Sample Sample Mean 50,39 50,36 50,37 50,26 39,36 Sample 39,37 39,26 36,37 36,26 37,26 (c) Construct a sampling distribution for the mean by listing...
 The data in the table represent the ages of the winners of an award for the past five years. Use the data to answer questions (a) through (e). 52 52 51 59 41 (a) Compute the population mean, (b) Compute the mean for all C2 = 10 samples with size n = 2. Sample Sample Mean 52,59 52,52 52,41 52,51 59,52 Sample Sample Mean 59,41 59,51 52.41 52,51 41,51 (c) Construct a sampling distribution for the mean by listing the...
Most questions answered within 3 hours.
-
A hedge fund is holding a three-year,
$10 million face value 6 percent annual coupon bond...
asked 3 minutes ago -
The focal length of a makeup (concave) mirror is 0.48 m. What
magnification does this mirror...
asked 7 minutes ago -
TRUE/FALSE
Long-lived assets that are tangible in nature, used in the
operations of the business, and...
asked 8 minutes ago -
A dragon biologist is setting up an experimental population of
1000 individuals. In dragons, pointy crests...
asked 19 minutes ago -
A uniform thin rod of length 0.851 m is hung from a horizontal
nail passing through...
asked 29 minutes ago -
A 747 has a cruising speed of 235 m/s at a height of 10,700
meters. The...
asked 37 minutes ago -
Part 3: Arrows
Write a python program that prompts the user for a number of
columns,...
asked 45 minutes ago -
Need help answering these questions!!
1. What economic concept do you find most interesting in
Macroeconomics?...
asked 49 minutes ago -
1. Nimbus, Inc. produces and sells brooms. This table shows the
relationship between the number of...
asked 52 minutes ago -
A gas occupies 200. mL in a piston. If the pressure of the
piston were decreased...
asked 1 hour ago -
A fossil is found to have a 14C level of 71.0% compared to
living organisms. How...
asked 1 hour ago -
Many communist or socialist countries have a department that
addresses public health as well as the...
asked 1 hour ago