


Homework Answers


Add Answer to:
Stacked An economy is initially described by the following equations: C = 60+ 0.8(Y-T) I =...
An economy is initially described by the following equations: a. Derive and graph the IS and...
 An economy is initially described by the following equations: a. Derive and graph the IS and LM curves. Use the accompanying diagram to graph the IS and LM curves by placing the endpoints at the correct location, then place point A at the equilibrium interest rate and level of income. C = 60+ 0.8(Y-T) I = 120-5r M/P=Y-25r G = 200 T= 200 M = 3000 P=3 IS: Y= LM: Y= IS-LM Graph 800 850 900 950 1,000 1,050 1,100...
An economy is initially described by the following equations: C = 60 + 0.8(Y-T) I =...
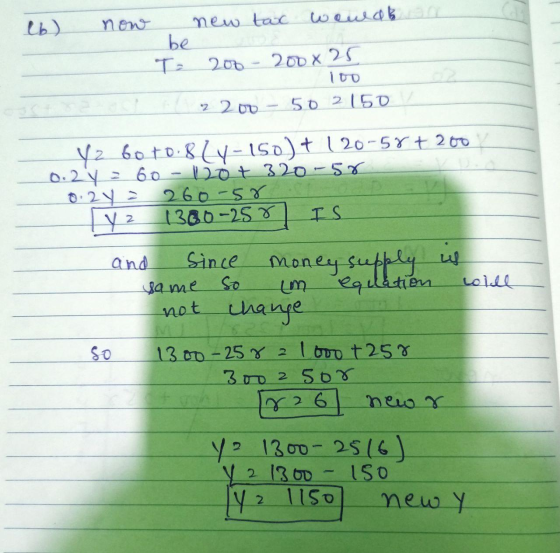
 An economy is initially described by the following equations: C = 60 + 0.8(Y-T) I = 120-5 M/P = Y-25 G = 200 T = 200 M = 3000 P = 3 d. Now assume that the central bank adjusts the money supply to hold the level of income constant. What is the new equilibrium interest rate? What must the money supply be? What is the tax multiplier? new equilibrium : 10 new money supply: 2400 tax multiplier: -4 Incorrect...
Assignment Score: 91.7% Resources C Give Up? Feedback Resume Questions of A Stacked Attempt An economy...
 Assignment Score: 91.7% Resources C Give Up? Feedback Resume Questions of A Stacked Attempt An economy is initially described by the following equations: C-60+ 0.8Y- 1 - 120-57 M/P-Y-25 G200 T-200 M - 3000 P-3 c. Now assume that the central bank adjust the money supply to hold the interest rate constant. What is the new level of income? What must the new money supply be? What is the tax multiplier? new equilibrium Y 1250 new money supply: 3600 tax...
graph the IS and LM curves An economy is initially described by the following equations: C...
 graph the IS and LM curves
An economy is initially described by the following equations: C = 60+ 0.8(Y-T) 1 = 120-5 M/P=Y-25r G = 200 T = 200 M = 3000 P-3 a. Derive and graph the IS and LM curves. Use the accompanying diagram to graph the IS and LM curves by placing the following equations: a. Derive and graph the IS and LM curves. Use the accompanying diagram to graph the IS and LM curves by placing...
graph the IS and LM curves
An economy is initially described by the following equations: C = 60+ 0.8(Y-T) 1 = 120-5 M/P=Y-25r G = 200 T = 200 M = 3000 P-3 a. Derive and graph the IS and LM curves. Use the accompanying diagram to graph the IS and LM curves by placing the following equations: a. Derive and graph the IS and LM curves. Use the accompanying diagram to graph the IS and LM curves by placing...
Question 1 of 6 > Stacked O Attempt An economy is initially described by the following...
 Question 1 of 6 > Stacked O Attempt An economy is initially described by the following equations: C - 60+ 0.8(Y-T 1 - 120-57 MIP-Y-257 G=200 T-200 M-3000 P3 a. Derive and graph the IS and LM curves. Use the accompanying diagram to graph the IS and LM curves by placing the endpoints at the correct location, then place point at the equilibrium interest rate and level of income. IS: Y- 1100 - 25 LM: Y 1000+ 25 IS-LM Graph...
2. A small open economy is described by the following equations: C=50+0.75(Y-T) 1- 200 20 NX-200-50...
 2. A small open economy is described by the following equations: C=50+0.75(Y-T) 1- 200 20 NX-200-50 G- 200 T-200 M 3000 P-3 r' = 5 (a) Derive and graph the IS and LM* curves. (b) Calculate the equilibrium exchange rate, level of income, and net exports (c) Assume a floating exchange rate. Calculate what happens to the exchange rate, the level of income, net exports, and the money supply if the government increases spending by 50. Use a graph to...
1. In an economy which has a national income identity as the following; Y= C+ I + G + NX where C ...
 I need help with this.
1. In an economy which has a national income identity as the following; Y= C+ I + G + NX where C = 400 + 0.6 Yd,; 1 = 1000-4600 r, G-1240 T-200 +0.25 Y; NX-400-0.05Y-8 00 e ( ofcourse, Yd=Y-T) Where e- foreign currency/ domestic currency, and initially set at e 1.25+2.5R The money demand function is Md- 0.75 Y-7500 r, and money supply is set by the Central Bank at 450. All calculation...
I need help with this.
1. In an economy which has a national income identity as the following; Y= C+ I + G + NX where C = 400 + 0.6 Yd,; 1 = 1000-4600 r, G-1240 T-200 +0.25 Y; NX-400-0.05Y-8 00 e ( ofcourse, Yd=Y-T) Where e- foreign currency/ domestic currency, and initially set at e 1.25+2.5R The money demand function is Md- 0.75 Y-7500 r, and money supply is set by the Central Bank at 450. All calculation...
4. Consider the following numerical example of the IS-LM model C 0.8(Y T); I 1520 240i;...
 4. Consider the following numerical example of the IS-LM model C 0.8(Y T); I 1520 240i; T 150 0.25Y; G 200; (M/P)s 1800 (M/P)D 300 0.75Y 300i a. Derive the IS and LM relation. (10%) b. Solove for the equilibrium values of output, interest rate, disposable income.(10%) 400 and T becomes T 350 0.25Y c. Suppose that G rises by 200 to G = Simultaneously, the central bank decreases money supply to 1500. Calculate what will happen to Y* and...
A small open economy is described by the following set of equations: C = 300 +...
A small open economy is described by the following set of equations: C = 300 + 0.6(Y − T) I = 700 − 80r NX = 200 − 50ε G = T = 500 (Balanced Budget) (M/P)^d = Y − 200r M = 3, 000 P = 3 r ∗ = 5 (a) Derive and graph the IS∗ and LM∗ curves. (b) Calculate the equilibrium exchange rate, income and net exports. (c) Assume a floating exchange rate. Calculate what happens...
Consider the economy of Hicksonia a. The consumption function is given by C = 200 +...
Consider the economy of Hicksonia a. The consumption function is given by C = 200 + 0.6(Y- T). The investment function is I = 200 - 40r. Government purchases and taxes are both 100. For this economy, graph the IS curve for r changing from 0 to 8. b. The money demand function in Hicksonia is (M/P)d = Y - 100r The money supply M is 1000 and the price level P is 2. For this economy, graph the LM...
 An economy is initially described by the following equations: a. Derive and graph the IS and LM curves. Use the accompanying diagram to graph the IS and LM curves by placing the endpoints at the correct location, then place point A at the equilibrium interest rate and level of income. C = 60+ 0.8(Y-T) I = 120-5r M/P=Y-25r G = 200 T= 200 M = 3000 P=3 IS: Y= LM: Y= IS-LM Graph 800 850 900 950 1,000 1,050 1,100...
 An economy is initially described by the following equations: C = 60 + 0.8(Y-T) I = 120-5 M/P = Y-25 G = 200 T = 200 M = 3000 P = 3 d. Now assume that the central bank adjusts the money supply to hold the level of income constant. What is the new equilibrium interest rate? What must the money supply be? What is the tax multiplier? new equilibrium : 10 new money supply: 2400 tax multiplier: -4 Incorrect...
 Assignment Score: 91.7% Resources C Give Up? Feedback Resume Questions of A Stacked Attempt An economy is initially described by the following equations: C-60+ 0.8Y- 1 - 120-57 M/P-Y-25 G200 T-200 M - 3000 P-3 c. Now assume that the central bank adjust the money supply to hold the interest rate constant. What is the new level of income? What must the new money supply be? What is the tax multiplier? new equilibrium Y 1250 new money supply: 3600 tax...
 graph the IS and LM curves
An economy is initially described by the following equations: C = 60+ 0.8(Y-T) 1 = 120-5 M/P=Y-25r G = 200 T = 200 M = 3000 P-3 a. Derive and graph the IS and LM curves. Use the accompanying diagram to graph the IS and LM curves by placing the following equations: a. Derive and graph the IS and LM curves. Use the accompanying diagram to graph the IS and LM curves by placing...
graph the IS and LM curves
An economy is initially described by the following equations: C = 60+ 0.8(Y-T) 1 = 120-5 M/P=Y-25r G = 200 T = 200 M = 3000 P-3 a. Derive and graph the IS and LM curves. Use the accompanying diagram to graph the IS and LM curves by placing the following equations: a. Derive and graph the IS and LM curves. Use the accompanying diagram to graph the IS and LM curves by placing...
 Question 1 of 6 > Stacked O Attempt An economy is initially described by the following equations: C - 60+ 0.8(Y-T 1 - 120-57 MIP-Y-257 G=200 T-200 M-3000 P3 a. Derive and graph the IS and LM curves. Use the accompanying diagram to graph the IS and LM curves by placing the endpoints at the correct location, then place point at the equilibrium interest rate and level of income. IS: Y- 1100 - 25 LM: Y 1000+ 25 IS-LM Graph...
 2. A small open economy is described by the following equations: C=50+0.75(Y-T) 1- 200 20 NX-200-50 G- 200 T-200 M 3000 P-3 r' = 5 (a) Derive and graph the IS and LM* curves. (b) Calculate the equilibrium exchange rate, level of income, and net exports (c) Assume a floating exchange rate. Calculate what happens to the exchange rate, the level of income, net exports, and the money supply if the government increases spending by 50. Use a graph to...
 I need help with this.
1. In an economy which has a national income identity as the following; Y= C+ I + G + NX where C = 400 + 0.6 Yd,; 1 = 1000-4600 r, G-1240 T-200 +0.25 Y; NX-400-0.05Y-8 00 e ( ofcourse, Yd=Y-T) Where e- foreign currency/ domestic currency, and initially set at e 1.25+2.5R The money demand function is Md- 0.75 Y-7500 r, and money supply is set by the Central Bank at 450. All calculation...
I need help with this.
1. In an economy which has a national income identity as the following; Y= C+ I + G + NX where C = 400 + 0.6 Yd,; 1 = 1000-4600 r, G-1240 T-200 +0.25 Y; NX-400-0.05Y-8 00 e ( ofcourse, Yd=Y-T) Where e- foreign currency/ domestic currency, and initially set at e 1.25+2.5R The money demand function is Md- 0.75 Y-7500 r, and money supply is set by the Central Bank at 450. All calculation...
 4. Consider the following numerical example of the IS-LM model C 0.8(Y T); I 1520 240i; T 150 0.25Y; G 200; (M/P)s 1800 (M/P)D 300 0.75Y 300i a. Derive the IS and LM relation. (10%) b. Solove for the equilibrium values of output, interest rate, disposable income.(10%) 400 and T becomes T 350 0.25Y c. Suppose that G rises by 200 to G = Simultaneously, the central bank decreases money supply to 1500. Calculate what will happen to Y* and...
Most questions answered within 3 hours.
-
3) What are the typical social structures in a global city?
asked 1 hour ago -
Luther Corporation
Consolidated Balance Sheet
December 31, 2019 and 2018 (in $ millions)
Assets
2019
2018...
asked 1 hour ago -
(Expected rate of return and risk) Carter Inc. is evaluating a
security. Calculate the investment’s expected...
asked 4 hours ago -
What specific indicators can point to lack of progress for
African Americans in American society?
asked 5 hours ago -
1-The Electrons in a beam are moving at 2.7×10⁸ m/s in an
electric field of 15000...
asked 5 hours ago -
A gas tank is a vertical cylinder. It has a radius of 1m, a
height of...
asked 5 hours ago -
Accent Software faces the following conditions. All of these
support Accent’s use of a market-penetration pricing...
asked 6 hours ago -
A mathematically inclined friend emails you the following
instructions: "Meet me in the cafeteria the first...
asked 6 hours ago -
A monopoly sells in two countries . The demand curves in the two
countries are p1...
asked 7 hours ago -
A .15kg rubber ball is bounced off a wall. Before hitting the
wall, the ball moves...
asked 8 hours ago -
A manufacturing company preparing to build a new plant is
considering three potential locations for it....
asked 8 hours ago -
B. If compound Y has approximately the same values of solubility
in toluene as compound X,...
asked 9 hours ago