
Homework Answers
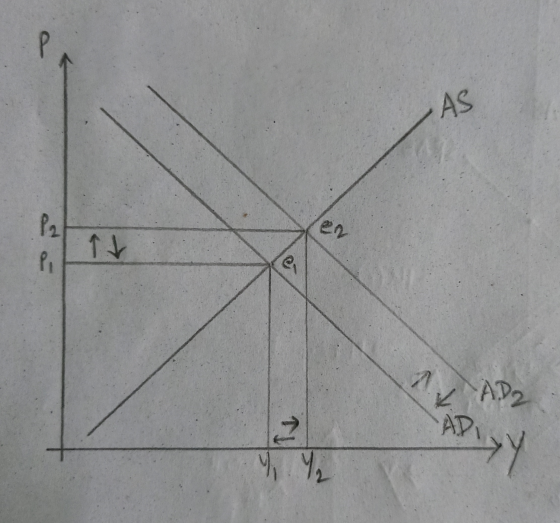
A demand pull inflation is when increase in aggregate demand (more than aggregate supply) pushes prices upwards causing inflation. Basically there are too many dollar bills chasing a lesser number of goods & services - which raise prices.
This is demonstrated in the graph through an increase in AD from AD1 to AD2. The AD curve shifts right. This leads equilibrium prices to be higher at P2 from P1. While equilibrium output increases along the AS curve from e1 to e2 and new output is Y2.
A macroeconomic policy that can curb the demand pull inflation would be contractionary fiscal policy. A contractionary fiscal policy like decrease in government purchases (will decrease output and prices to original level through multiplier effect). The impact of a contractionary fiscal policy will be a leftward shift in AD curve. When G falls, AD falls. AD returns from AD2 to AD1. This causes output and prices to return to Y1 and P1. The amount of decrease in G has to be decided based on the output gap and the mpc (multiplier) of the economy.
Add Answer to:
Define demand-pull inflation. Using the AS/AD model, explain how demand-pull inflation affects the level of aggregate...
2. Please briefly define aggregate demand (AD), aggregate supply (AS), and the price level (P). Why...
 2. Please briefly define aggregate demand (AD), aggregate supply (AS), and the price level (P). Why do the AD curve slope downwards and what will be the impact on the P if AD curve shifts to the right? Show all of these interactions and the new equilibrium level on the diagram. How do you call this type of inflation according to the theory? (15 pts.) What are the altermative GDP measurement methods? What is the main difference between the methods?...
Given a downward-sloping aggregate demand (AD) curve and an upward-sloping short-run aggregate supply curve (SRAS), equilibrium...
Given a downward-sloping aggregate demand (AD) curve and an upward-sloping short-run aggregate supply curve (SRAS), equilibrium occurs where the two intersect. The value on the vertical axis is the equilibrium price level and the value on the horizontal axis is the equilibrium value of real GDP or output. What happens to the economy when AD shifts? It is useful to sketch a graph and show the shift. Suppose, for example, interest rates fall or wealth increases due to a stock...
The economic model of aggregate demand curve and aggregate supply curve helps explain the A. three...
The economic model of aggregate demand curve and aggregate supply curve helps explain the A. three goals of economic policy which are economic growth, high inflation, and full employment. B. expansion and contractions in individual markets. C. shifts in real GDP and the price level. Which of the following descriptions reflects the AD-AS model most accurately? A. Real GDP is shown on the vertical axis and the price level is shown on the horizontal axis. B. Aggregate supply is shown...
Using aggregate supply and demand analysis, discuss how the following will affect the aggregate level of...
Using aggregate supply and demand analysis, discuss how the following will affect the aggregate level of output and the price level in the economy. Use a SRAS curve. You need to determine whether the AD or SRAS curve will shift, in which direction it will shift, and how this will affect aggregate output and the price level. a. Price of standardized inputs such as oil decrease. b. A fall in the stock market.
On the following graph, draw the aggregate demand (AD) and aggregate supply (AS) curves using the...
 On the following graph, draw the aggregate demand (AD) and aggregate supply (AS) curves using the data in the table that lead to a full-employment equilibrium and then answer additional questions: Instructions: Use the tools provided 'AD,' and 'AS' to draw the demand curve (AD1) and the supply curve (AS). Each curve should contain 10 reference points. Price Level Real Output Real Output Demanded Supplied (5) 140 600 700 1,200 1,150 1,100 1,050 (1250, 105) Price Level (Prey 1 of...
1. An introduction to the AD-AS model The AD-AS (aggregate demand and aggregate supply) model is...
1. An introduction to the AD-AS model The AD-AS (aggregate demand and aggregate supply) model is a useful simplification of the macroeconomy. The horizontal axis of a diagram of the AD and AS curves measures which of the following? The price of one particular representative good produced in the economy The amount of one particular representative good produced in the economy An economy's price level An economy's aggregate output The vertical axis of a diagram of the AD and AS...
1. Using aggregate supply and demand analysis, discuss how the following will affect the aggregate level...
 1. Using aggregate supply and demand analysis, discuss how the following will affect the aggregate level of output and the price level in the economy. Use an SRAS curve and an AD curve. You need to determine whether the AD or SRAS curve will shift, in which direction it will shift, and how this will affect aggregate output and the price level. (8 points) a. A hurricane that destroys half the supply of goods produced in Florida. b. An increase...
The graph depicts a dynamic aggregate demand (AD) and aggregate supply (AS) model of the economy....
 The graph depicts a dynamic aggregate demand (AD) and aggregate supply (AS) model of the economy. Suppose that in 2003, the economy is in macroeconomic equilibrium, with GDP at GDP (year 1). The Fed projects that in 2004, the aggregate demand curve will be AD (year 2), that potential real GDP will be $12.45 trillion (GDP (year 2), and that actual real GDP will be $12.39 trillion LRAS (year 1) LRAS (year 2) SRAS (ycar1) SRAS (year 2 ear Year...
“Cost-push inflation is usually referred to as supply side inflation.” Using aggregate demand and aggregate supply...
 “Cost-push inflation is usually referred to as supply side inflation.” Using aggregate demand and aggregate supply model, explain and show the causes and effects of cost push inflation on price level and output in the economy.
The graph below depicts an economy where an increase in aggregate demand has caused inflation. The...
 The graph below depicts an economy where an increase in aggregate demand has caused inflation. The economy's current level of real GDP (Y) is above its long-run equilibrium. This is illustrated by the long-run aggregate supply curve (LRAS) and a price level 2) above the equilibrium value of Pe Fiscal Policy Price Level Real GDP Which of the following is an example of an automatic stabilizer that would help this economy move toward full employment again A reduced need for...
 2. Please briefly define aggregate demand (AD), aggregate supply (AS), and the price level (P). Why do the AD curve slope downwards and what will be the impact on the P if AD curve shifts to the right? Show all of these interactions and the new equilibrium level on the diagram. How do you call this type of inflation according to the theory? (15 pts.) What are the altermative GDP measurement methods? What is the main difference between the methods?...
 On the following graph, draw the aggregate demand (AD) and aggregate supply (AS) curves using the data in the table that lead to a full-employment equilibrium and then answer additional questions: Instructions: Use the tools provided 'AD,' and 'AS' to draw the demand curve (AD1) and the supply curve (AS). Each curve should contain 10 reference points. Price Level Real Output Real Output Demanded Supplied (5) 140 600 700 1,200 1,150 1,100 1,050 (1250, 105) Price Level (Prey 1 of...
 1. Using aggregate supply and demand analysis, discuss how the following will affect the aggregate level of output and the price level in the economy. Use an SRAS curve and an AD curve. You need to determine whether the AD or SRAS curve will shift, in which direction it will shift, and how this will affect aggregate output and the price level. (8 points) a. A hurricane that destroys half the supply of goods produced in Florida. b. An increase...
 The graph depicts a dynamic aggregate demand (AD) and aggregate supply (AS) model of the economy. Suppose that in 2003, the economy is in macroeconomic equilibrium, with GDP at GDP (year 1). The Fed projects that in 2004, the aggregate demand curve will be AD (year 2), that potential real GDP will be $12.45 trillion (GDP (year 2), and that actual real GDP will be $12.39 trillion LRAS (year 1) LRAS (year 2) SRAS (ycar1) SRAS (year 2 ear Year...
 “Cost-push inflation is usually referred to as supply side inflation.” Using aggregate demand and aggregate supply model, explain and show the causes and effects of cost push inflation on price level and output in the economy.
 The graph below depicts an economy where an increase in aggregate demand has caused inflation. The economy's current level of real GDP (Y) is above its long-run equilibrium. This is illustrated by the long-run aggregate supply curve (LRAS) and a price level 2) above the equilibrium value of Pe Fiscal Policy Price Level Real GDP Which of the following is an example of an automatic stabilizer that would help this economy move toward full employment again A reduced need for...
Most questions answered within 3 hours.
-
The average length of time between arrivals at a turnpike
toll-booth is 26 seconds. What is...
asked 1 hour ago -
(a) A piston at 6.1 atm contains a gas that occupies a volume of
3.5 L....
asked 2 hours ago -
Please answer true or false. Words
cannot be changed or added in to make it true...
asked 2 hours ago -
An empty test tube weighs 15.923 grams. Then,
MgCl2•6H2O is added into the test tube. After...
asked 2 hours ago -
Assume memory access is 10 units of time and disk access is
10000 units of time....
asked 2 hours ago -
1. Are all good samples random?
2. Magazines often report surveys giving statistics such as “63%...
asked 3 hours ago -
Under all the various types of market structures, firms
must eventually earn some economic profits for...
asked 2 hours ago -
Consider the following fitness regime for a single locus trait
with two co-dominant alleles: w11 =...
asked 2 hours ago -
A large cable company reports the following.
80% of its customers subscribe to its cable TV...
asked 3 hours ago -
Please answer the question in brief.
Discuss the role of ERP in organizations. Are ERP tools...
asked 2 hours ago -
Discuss the pros and cons of collaborative software such
as SameTime. Does it increase productivity? What...
asked 3 hours ago -
Buying your in-laws a gift because it’s expected is
due to the ____________ motive of gift-giving....
asked 3 hours ago