
Homework Answers
us cars
Japanese cars


Add Answer to:
1. The following data set contains miles per gallon (MPG) for U.S. cars (sample 1) and...
In a meeting, Matt estimates the average miles per gallon (mpg) of the fleet cars is...
In a meeting, Matt estimates the average miles per gallon (mpg) of the fleet cars is 24 mpg. With a certain level of confidence, he announces the actual mpg is in the 21 to 27 mpg range. What is the Margin of Error? A. 6 mpg B. 24 mpg C. 3 mpg D. 0.50 mpg
The data below represents the overall miles per gallon (MPG) of 2008 SUVs priced under $30,000....
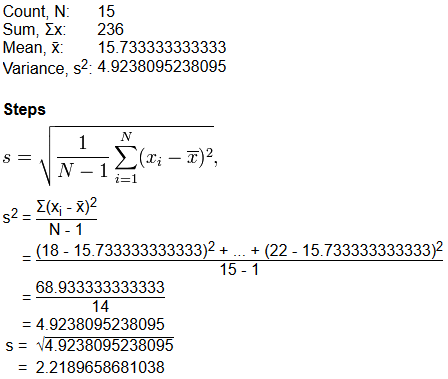
 The data below represents the overall miles per gallon (MPG) of 2008 SUVs priced under $30,000. Complete parts a and b below. 24, 18, 22, 20, 18, 19, 16, 16, 20, 18, 20, 18, 21, 18, 18, 19, 16, 17, 16, 21,17, 21 a. Construct a 95% confidence interval estimate for the population mean miles per gallon of 2008 SUVs priced under $30,000, assuming a normal distribution. s μ s DRound to two decimal places as needed.) b. Interpret the...
The table below contains the overall miles per gallon (MPG) of a type of vehicle. Complete...
The table below contains the overall miles per gallon (MPG) of a type of vehicle. Complete parts a and b below. 29 23 32 33 22 20 20 23 24 27 43 23 30 25 Construct a 99% confidence interval estimate for the population mean MPG for this type of vehicle, assuming a normal distribution. The 99% confidence interval estimate is from ___ MPG to ___ MPG. (Round to one decimal place as needed.)
The table below contains the overall miles per gallon (MPG) of a type of vehicle. 28...
The table below contains the overall miles per gallon (MPG) of a type of vehicle. 28 29 24 22 29 32 23 25 35 32 35 23 26 34 Choose the correct answer below. A.We have 95% confidence that the mean MPG of this type of vehicle for the sample is contained in the interval. B. 95% of the sample data fall between the limits of the confidence interval. C. The mean MPG of this type of vehicle for 95%...
Cars > 1.5 tons Highway MPG (miles per gallon) 25 31 24 28 23 30 28...
Cars > 1.5 tons Highway MPG (miles per gallon) 25 31 24 28 23 30 28 30 26 24 25 26 27 25 29 26 28 27 30 30 22 24 28 28 28 28 27 26 26 26 26 25 29 28 26 28 25 26 21 21 24 23 20 23 22 20 Find the standard deviation, quartiles and fences of the given data.
It is necessary for an automobile producer to estimate the number of miles per gallon (mpg)...
It is necessary for an automobile producer to estimate the number of miles per gallon (mpg) achieved by its cars. Suppose that the sample mean for a random sample of 40 cars is 28.8 mpg and assume the standard deviation is 2.3 mpg. Now suppose the car producer wants to test the hypothesis that μ, the mean number of miles per gallon, is 29.3 against the alternative hypothesis that it is not 29.3. Conduct a test using a significance level...
Question 18 8 pts A test team takes readings from the miles per gallon (mpg) estimate...
 Question 18 8 pts A test team takes readings from the miles per gallon (mpg) estimate reading in a new car while driving at 60 mph. The sample consists of 30 readings and has a mean of 31.3 mpg and a standard deviation of 11.7 mpg. The average mpg of all new cars is 27.6 mpg although the standard deviation is unknown. Determine the 95% confidence interval for the true miles per gallon for the new cars. В І у...
The data set below contains the overall miles per gallon (MPG) of 20 small SUVs from...
The data set below contains the overall miles per gallon (MPG) of 20 small SUVs from one year. Complete parts (a) and (b). 26 26 24 22 22 22 22 21 21 22 20 20 21 21 21 21 21 21 21 21 Decide whether the data appear to be approximately normally distributed by comparing data characteristics to theoretical properties. Based on the theoretical properties of the normal distribution, do the data appear to be approximately normally distributed? yes/no THE...
The combined gas mileage of mid-size cars varies with mean 25 miles per gallon (mpg) and...
The combined gas mileage of mid-size cars varies with mean 25 miles per gallon (mpg) and a standard deviation of about 5.3 mpg. A particular rental car agency typically has 88 midsize cars in its lot. Assume the distribution of combined gas mileage of mid-size cars is Normal. Find the probability that the combined gas mileage for a randomly selected car in the lot is higher than 25 mpg. Find the probability that the mean combined gas mileage for all...
a certain car model has a mean gas mileage of 34 Miles per gallon (mpg) with...
 a certain car model has a mean gas mileage of 34 Miles per
gallon (mpg) with a population standard deviation for. A pizza
delivery company buys a sample of 54 of these cars. What is the
probability that the average mileage of the fleet is greater than
33.7 MPG?
Question 14 (3 points) A certain car model has a mean gas mileage of 34 miles per gallon (mpg) with a population standard deviation 4. A pizza delivery company buys a...
a certain car model has a mean gas mileage of 34 Miles per
gallon (mpg) with a population standard deviation for. A pizza
delivery company buys a sample of 54 of these cars. What is the
probability that the average mileage of the fleet is greater than
33.7 MPG?
Question 14 (3 points) A certain car model has a mean gas mileage of 34 miles per gallon (mpg) with a population standard deviation 4. A pizza delivery company buys a...
 The data below represents the overall miles per gallon (MPG) of 2008 SUVs priced under $30,000. Complete parts a and b below. 24, 18, 22, 20, 18, 19, 16, 16, 20, 18, 20, 18, 21, 18, 18, 19, 16, 17, 16, 21,17, 21 a. Construct a 95% confidence interval estimate for the population mean miles per gallon of 2008 SUVs priced under $30,000, assuming a normal distribution. s μ s DRound to two decimal places as needed.) b. Interpret the...
 Question 18 8 pts A test team takes readings from the miles per gallon (mpg) estimate reading in a new car while driving at 60 mph. The sample consists of 30 readings and has a mean of 31.3 mpg and a standard deviation of 11.7 mpg. The average mpg of all new cars is 27.6 mpg although the standard deviation is unknown. Determine the 95% confidence interval for the true miles per gallon for the new cars. В І у...
 a certain car model has a mean gas mileage of 34 Miles per
gallon (mpg) with a population standard deviation for. A pizza
delivery company buys a sample of 54 of these cars. What is the
probability that the average mileage of the fleet is greater than
33.7 MPG?
Question 14 (3 points) A certain car model has a mean gas mileage of 34 miles per gallon (mpg) with a population standard deviation 4. A pizza delivery company buys a...
a certain car model has a mean gas mileage of 34 Miles per
gallon (mpg) with a population standard deviation for. A pizza
delivery company buys a sample of 54 of these cars. What is the
probability that the average mileage of the fleet is greater than
33.7 MPG?
Question 14 (3 points) A certain car model has a mean gas mileage of 34 miles per gallon (mpg) with a population standard deviation 4. A pizza delivery company buys a...
Most questions answered within 3 hours.
-
Derive the long wavelength limit of the Planck energy density
distribution
asked 2 minutes ago -
Phosphorous + bromine = phosphorous tribromide. If 35.0 g of
bromine are reacted and 27.9 grams...
asked 12 minutes ago -
Calculate the pH of each of the following solutions.
0.50 M HBr
3.1×10⁻⁴ M KOH
4.2×10⁻⁵...
asked 3 hours ago -
For the year ended December 31, Depot Max’s cost of merchandise
sold was $85,600. Inventory at the...
asked 3 hours ago -
Week 10 - Professional Memo Assignment
Professional Memo Assignment
Your mission for this week, should you...
asked 3 hours ago -
Write a Python program that stores the data for each
player on the team, and it...
asked 3 hours ago -
In
the last 3 months, mike never knows when he is going to get his
allowance...
asked 4 hours ago -
Is Ca(OH)2 a Bronsted base, Lewis base, or both? Why?
asked 4 hours ago -
1A- Why don’t voters complain about U.S. tariffs on imported
sugar?
Because sugar is only a...
asked 4 hours ago -
Cash Payback Period
Primera Banco is evaluating two capital investment proposals for
a drive-up ATM kiosk,...
asked 4 hours ago -
Create a button in Swift (Xcode) that will create a charge,
create a charge using Stripe's...
asked 4 hours ago -
The reaction rate of CO and NO2 in the reaction
CO(g) + NO2(g) → CO2(g) +...
asked 4 hours ago