A researcher was interested in comparing the heights of women in two different countries.
A researcher was interested in comparing the heights of women in two different countries. Independent simple random samples of 9 women from country A and 9 women from country B yielded the following heights (in inches).
Country A: 64.1 66.4 61.7 62.0 67.3 64.9 64.7 68.0
Country B: 65.3 60.2 61.7 65.8 61.0 64.6 60.0 65.4 59.0
At the 5% significance level, do the data provide sufficient evidence to conclude that the mean height of women in country A is different from the mean height of women in country B? Assume both populations are normal.
a) State the null and alternative hypotheses symbolically.
b) Use 1-var-stats to find the sample means and the sample standard deviations.
c) Check assumptions and choose an appropriate test procedure.
d) Compute the value of the test statistic.
e) Determine the P-value. Please show your work.
f) Decide on the null hypothesis (reject H, or do not reject Ho).
g) Interpret the results of the hypothesis test.
Homework Answers
Here, we are given that a researcher was interested in comparing the heights of women in two different countries. at 5% level of significance we have to test that whether the data provides sufficient evidence to conclude that the mean height of woman in country A is different from the mean height of women in country B.
a) The null and the alternative hypothesis are-
H0: µ1 = µ2 vs H1: µ1 ≠ µ2 where,
 :
is the true population mean of heights of women in country A.
:
is the true population mean of heights of women in country A.
 :
is the true population mean of heights of women in country B.
:
is the true population mean of heights of women in country B.
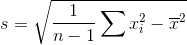
b) To calculate the sample mean and sample sd we consider the following formula-
, 
For country A:
 = sample mean = 64.74
s = sample sd = 0.19
For country B:
= sample mean = 61.44
s = sample sd = 4.72
c) We have to check for assumptions and choose a appropriate test procedure. We assume that both the populations are normal and have equal variance so we opt for a 2- sample t test.
d) We have to calculate the value of the test statistic which is given by-

Where, n1 is the sample size of the first sample = 9
n2 is the sample size of the first sample = 9
 sample mean of first sample = 64.74
 sample mean of second sample = 61.44
s is the sample pooled variance = 3.6795
Therefore,
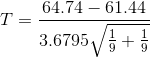
= 1.9
Add Answer to:
A researcher was interested in comparing the heights of women in two different countries.
A researcher was interested in comparing the heights of women in two different countries
A researcher was interested in comparing the heights of women in two different countries. Independent simple random samples of 9 women from country A and 9 women from country B yielded the following heights (in inches). Country A: 64.1 66.4 61.7 62.0 67.3 64.9 64.7 68.0 63.6 Country B: 65.3 60.2 61.7 65.8 61.0 64.6 60.0 65.4 59.0 At the 5% significance level, do the data provide sufficient evidence to conclude that the mean height of women in country A is different from...
A report included the following information on the heights (in.) for non-Hispanic white females. Age 20-39...
 A report included the following information on the heights (in.) for non-Hispanic white females. Age 20-39 60 and older Sample Sample Std. Error Size Mean Mean 868 64.7 0.09 933 63. 1 0 .11 (a) Calculate a confidence interval at confidence level approximately 95% for the difference between population mean height for the younger women and that for the older women. (Use U20-39 - M 60 and older.) Interpret the interval. We are 95% confident that the true average height...
A report included the following information on the heights (in.) for non-Hispanic white females Sample Sample...
 A report included the following information on the heights (in.) for non-Hispanic white females Sample Sample Std. Error Mean Mean Age Size 20-39 64.7 867 0.09 60 and older 934 63.1 0.11 (a) Calculate a confidence interval at confidence level approximately 95% for the difference between population mean height for the younger women and that for the older women. (Use n39-H0 and older) 2.01 Interpret the interval. OWe are 95% confident that the true average height of younger women is...
ill in the blank is 1. reject/do not reject 2. provide/does not provide and 3. less...
 ill in the blank is 1. reject/do not reject 2. provide/does not
provide and 3. less than, the same as, greater than, different
from
Suppose the mean height of women age 20 years or older in a certain country is 62.6 inches. One hundred randomly selected women in a certain city had a mean height o 61.0 inches. At the 5% significance level do the data provide sufficient evidence to conclude that the mean he t o wormer c differs...
ill in the blank is 1. reject/do not reject 2. provide/does not
provide and 3. less than, the same as, greater than, different
from
Suppose the mean height of women age 20 years or older in a certain country is 62.6 inches. One hundred randomly selected women in a certain city had a mean height o 61.0 inches. At the 5% significance level do the data provide sufficient evidence to conclude that the mean he t o wormer c differs...
Suppose the mean height of women age 20 years or older in a certain country is...
Suppose the mean height of women age 20 years or older in a certain country is 62.6 inches. One hundred randomly selected women in a certain city had a mean height of 61.5 inches. At the 11% significance level, do the data provide sufficient evidence to conclude that the mean height of women in the city differs from the national mean? Assume that the population standard deviation of the heights of women in the city is 3.63.6 inches. Set up...
section 9.4 Suppose the mean height of women age 20 years or older in a certain...
 section 9.4
Suppose the mean height of women age 20 years or older in a certain country is 62.5 inches. One hundred randomly selected women in a certain city had a mean height of 61.0 inches. At the 1% significance level, do the data provide sufficient evidence to conclude that the mean height of women in the city differs from the national mean? Assume that the population standard deviation of the heights of women in the city is 4.1 inches...
section 9.4
Suppose the mean height of women age 20 years or older in a certain country is 62.5 inches. One hundred randomly selected women in a certain city had a mean height of 61.0 inches. At the 1% significance level, do the data provide sufficient evidence to conclude that the mean height of women in the city differs from the national mean? Assume that the population standard deviation of the heights of women in the city is 4.1 inches...
 A report included the following information on the heights (in.) for non-Hispanic white females. Age 20-39 60 and older Sample Sample Std. Error Size Mean Mean 868 64.7 0.09 933 63. 1 0 .11 (a) Calculate a confidence interval at confidence level approximately 95% for the difference between population mean height for the younger women and that for the older women. (Use U20-39 - M 60 and older.) Interpret the interval. We are 95% confident that the true average height...
 A report included the following information on the heights (in.) for non-Hispanic white females Sample Sample Std. Error Mean Mean Age Size 20-39 64.7 867 0.09 60 and older 934 63.1 0.11 (a) Calculate a confidence interval at confidence level approximately 95% for the difference between population mean height for the younger women and that for the older women. (Use n39-H0 and older) 2.01 Interpret the interval. OWe are 95% confident that the true average height of younger women is...
 ill in the blank is 1. reject/do not reject 2. provide/does not
provide and 3. less than, the same as, greater than, different
from
Suppose the mean height of women age 20 years or older in a certain country is 62.6 inches. One hundred randomly selected women in a certain city had a mean height o 61.0 inches. At the 5% significance level do the data provide sufficient evidence to conclude that the mean he t o wormer c differs...
ill in the blank is 1. reject/do not reject 2. provide/does not
provide and 3. less than, the same as, greater than, different
from
Suppose the mean height of women age 20 years or older in a certain country is 62.6 inches. One hundred randomly selected women in a certain city had a mean height o 61.0 inches. At the 5% significance level do the data provide sufficient evidence to conclude that the mean he t o wormer c differs...
 section 9.4
Suppose the mean height of women age 20 years or older in a certain country is 62.5 inches. One hundred randomly selected women in a certain city had a mean height of 61.0 inches. At the 1% significance level, do the data provide sufficient evidence to conclude that the mean height of women in the city differs from the national mean? Assume that the population standard deviation of the heights of women in the city is 4.1 inches...
section 9.4
Suppose the mean height of women age 20 years or older in a certain country is 62.5 inches. One hundred randomly selected women in a certain city had a mean height of 61.0 inches. At the 1% significance level, do the data provide sufficient evidence to conclude that the mean height of women in the city differs from the national mean? Assume that the population standard deviation of the heights of women in the city is 4.1 inches...
Most questions answered within 3 hours.
-
Write a program to solve the Josephus problem, with the following
modification:
Sample Input:
./a.out n...
asked 1 hour ago -
At the start of a CD it is spinning at a rate of 525 rpm
(revolutions...
asked 2 hours ago -
4. Without doing any calculations, predict whether the observed
∆T would increase, decrease or remain the...
asked 3 hours ago -
Based on the range, which of the following sets of scores has
the greatest variability? 3,...
asked 4 hours ago -
Ripples in a pond travel at a velocity of 3 m/s with one peak
passing a...
asked 4 hours ago -
A man stands on the roof of a building of height 13.0 mm and
throws a...
asked 4 hours ago -
The extent to which assets are financed by borrowed funds and
other liabilities is indicated by:...
asked 5 hours ago -
Explain in detail
Germany is the fifth largest economy
explain what goods and services Germany specializes...
asked 5 hours ago -
The density of platinum is 21.45 g/mL. If a cube of platinum
with a mass of...
asked 5 hours ago -
Accounts Receivable
Sales
A/R Posting
Extended Sales Invoice
Packing Slip
Compare invoice to packing slip 2...
asked 5 hours ago -
Michaella, age 23, is a full-time law student and is claimed by
her parents as a...
asked 5 hours ago -
Why are polymers not typically casted into products?
asked 6 hours ago