| gender | income |
| Male | 48932 |
| Male | 48281 |
| Male | 49885 |
| Male | 48646 |
| Male | 49391 |
| Male | 48824 |
| Male | 49459 |
| Male | 48685 |
| Male | 48215 |
| Male | 49362 |
| Male | 47647 |
| Male | 48860 |
| Male | 47438 |
| Male | 47052 |
| Male | 48157 |
| Male | 48349 |
| Male | 49589 |
| Male | 48579 |
| Male | 48411 |
| Male | 49048 |
| Male | 48705 |
| Male | 49932 |
| Male | 48779 |
| Male | 47685 |
| Male | 48984 |
| Male | 48616 |
| Male | 47362 |
| Male | 46919 |
| Male | 47676 |
| Male | 47932 |
| Male | 48494 |
| Male | 49161 |
| Male | 48201 |
| Male | 48089 |
| Male | 48287 |
| Male | 48028 |
| Male | 48240 |
| Male | 48312 |
| Male | 47827 |
| Male | 47839 |
| Male | 48578 |
| Male | 49740 |
| Male | 48942 |
| Male | 49759 |
| Male | 48134 |
| Male | 47934 |
| Male | 47702 |
| Male | 46989 |
| Male | 48716 |
| Male | 49599 |
| Male | 48713 |
| Male | 49089 |
| Male | 48228 |
| Male | 48074 |
| Male | 48683 |
| Male | 48268 |
| Male | 47844 |
| Male | 49145 |
| Male | 49657 |
| Male | 49046 |
| Male | 47516 |
| Male | 48733 |
| Male | 48385 |
| Male | 47807 |
| Male | 49290 |
| Male | 47782 |
| Male | 48052 |
| Male | 49397 |
| Male | 49392 |
| Male | 48313 |
| Male | 47652 |
| Male | 48452 |
| Male | 48097 |
| Male | 47012 |
| Male | 48584 |
| Female | 46737 |
| Female | 48929 |
| Female | 47321 |
| Female | 47952 |
| Female | 47958 |
| Female | 47563 |
| Female | 47843 |
| Female | 46724 |
| Female | 46122 |
| Female | 48661 |
| Female | 47558 |
| Female | 47914 |
| Female | 46808 |
| Female | 48822 |
| Female | 48373 |
| Female | 47905 |
| Female | 47196 |
| Female | 46710 |
| Female | 46597 |
| Female | 46558 |
| Female | 47428 |
| Female | 46701 |
| Female | 47780 |
| Female | 47670 |
| Female | 48262 |
| Female | 47343 |
| Female | 48079 |
| Female | 46398 |
| Female | 47727 |
| Female | 47421 |
| Female | 47244 |
| Female | 48538 |
| Female | 47944 |
| Female | 47615 |
| Female | 48875 |
| Female | 46970 |
| Female | 48847 |
| Female | 46854 |
| Female | 47011 |
| Female | 47582 |
| Female | 47536 |
| Female | 48259 |
| Female | 48181 |
| Female | 47912 |
| Female | 47480 |
| Female | 48614 |
| Female | 47961 |
| Female | 47557 |
| Female | 47566 |
| Female | 46611 |
| Female | 47469 |
| Female | 47443 |
| Female | 47577 |
| Female | 46846 |
| Female | 46970 |
| Female | 48256 |
| Female | 47713 |
| Female | 47921 |
| Female | 48312 |
| Female | 48960 |
| Female | 47486 |
| Female | 47326 |
| Female | 48162 |
| Female | 48339 |
Do this by R and put the syntax of R and corresponding outputs under respective questions.
Homework Answers
Enter the all value of male dataset and call as X and y respectively .I.e.
x= c( )
y =c( l
n1 = 75
n2 =64
a) mean (x) = 48469.93
Sd(x) = 722.077
mean(y)=47640.578
sd (y) = 678.096
b) boxplot(x)
boxplot(y)


INTERPRETATION :- By observing two boxplot , both dataset male and female are symmetrically distributed.
c) t.test(x,y)
t = 6.975 ,
d.f = 137
P value = 0.0000
t cal = n1+ n2 -2 ,0.01 = 2.612
Hypothesis :-
The following null and alternative hypotheses need to be tested:
Ho: Two means are equal.
Ha: Two means are different.
Here p < alpha , reject H0
Interpretation :- mean salaries of males and females are statistically different at 0.01 significance level.
d) confint (x,y ,alpha = 0.01)
The 99% confidence interval is
518.729<μ1−μ2<1139.975.
Conclusion :- we are 90% confident that the mean difference is
lies between 518 729 and 1139.975
Add Answer to:
gender
income
Male
48932
Male
48281
Male
49885
Male
48646
Male
49391
Male
48824
Male
49459...
Do this homework by R and put the syntax of R and corresponding outputs under respective...
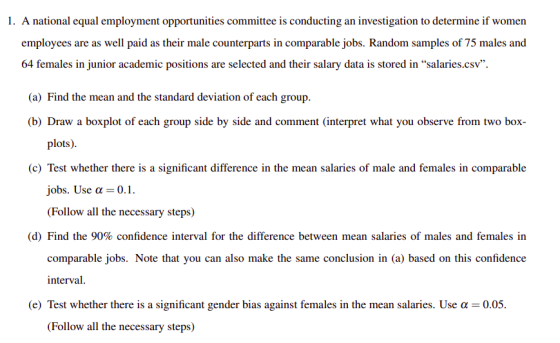
Do this homework by R and put the syntax of R and corresponding outputs under respective questions. Do not turn in separate pages of R commands and outputs, such homework will not be graded. Therefore edit your homework accordingly. 1. A national equal employment opportunities committee is conducting an investigation to determine if women employees are as well paid as their male counterparts in comparable jobs. Random samples of 75 males and 64 females in junior academic positions are selected...
A sample of 100 people is classified by gender (male/female) and by whether or not they...
A sample of 100 people is classified by gender (male/female) and by whether or not they are registered voters. The sample consists of 80 females and 20 males, and has a total of 60 registered voters. If these data were used for a chi-square test for independence, what is the expected frequency for males who are registered voters? Group of answer choices 12 40 20 60
A sample of 120 people is classified by gender (male/female) and by whether or not they...
A sample of 120 people is classified by gender (male/female) and by whether or not they are registered voters. The sample consists of 70 females and 50 males, and has a total of 60 registered voters. If these data are used for a chi-square test for independence, what is the total number of females for the expected frequencies of voters?
3. Listed below are sorted braking reaction times in 1 / 10,000 sec) for male and...
 3. Listed below are sorted braking reaction times in 1 / 10,000 sec) for male and female subjects (based on data from the RT-2S Brake Reaction Time Tester), also listed in the Excel file: Brake Reaction Time.rlsr. Male 28 30 31 34 34 36 38 38 38 38 39 40 40 40 40 41 41 41 | 42| 42| 40| 46 | 47 | 48 | 48 | 49 51 53 54 56 66 67 60 61 | 61 |...
a) b) Salary information regarding two independent random samples of male and female employees of a...
 a)
b)
Salary information regarding two independent random samples of male and female employees of a large company is shown below. Male Female 64 36 Sample size Sample mean salary (in $1000s) Population variance 44 41 128 72 If you are interested in testing whether the average salary of males is significantly greater than that of females, what is the null hypothesis? O Ho: male < female Ho male > female Ho: male > female None of the answers is...
a)
b)
Salary information regarding two independent random samples of male and female employees of a large company is shown below. Male Female 64 36 Sample size Sample mean salary (in $1000s) Population variance 44 41 128 72 If you are interested in testing whether the average salary of males is significantly greater than that of females, what is the null hypothesis? O Ho: male < female Ho male > female Ho: male > female None of the answers is...
A national equal employee opportunities committee is conducting an investigation to determine if women employees are...
A national equal employee opportunities committee is conducting an investigation to determine if women employees are as well paid as their male counterparts in comparable jobs. Random samples of 25 males and 28 females in junior academic positions are selected, and the following calculations are obtained from their salary data: Company A Company B Mean $45,230 $44,920 Stand deviation $780 $750 We want to test for the alternative hypothesis Ha: μA - μB > 0. The test statistic is a....
Salary information regarding male and female employees of a large company is shown below. Male Female...
Salary information regarding male and female employees of a large company is shown below. Male Female Sample Size 68 32 Sample Mean Salary (in $1,000s) 59 52 Population Variance (σ2) 272 160 In a test of whether or not the population average salary of males is significantly greater than that of females at α = 0.05, the p-value is 0.0098. a) The conclusion is that the population salaries of males and females are equal. b) there is no evidence that...
QUESTION 1 Salary information regarding two independent random samples of male and female employees of a...
 QUESTION 1 Salary information regarding two independent random samples of male and female employees of a large company is shown below. Male Female 36 41 72 Sample size 64 Sample mean salary (in44 S1000s) Population variance 128 The point estimate of the difference between the means of the two populations (Male - Female) is -28 4 -4 Refer to Question 1. The standard error for the difference between the two means is_ 4 7.46 4.24 2.0 Refer to Question 1...
A food company is developing a new granola bar, and its market analysts are currently working...
A food company is developing a new granola bar, and its market analysts are currently working on preliminary studies of the packaging design. To help with a marketing strategy, the company was first interested in whether the appeal of the packaging design for the new product (and hence the appeal of the product itself) was related to a person’s gender. There were 100 male and 100 female volunteers available for purposes of evaluation. Both males and females rated the design...
Do women feel differently from men when it comes to tax rates? One question on a...
 Do women feel differently from men when it comes to tax rates? One question on a survey of randomly selected adults asked, "What percent of income do you believe individuals should pay in income tax?" Complete parts a) through c). Click the icon to view the survey results. a) Draw side-by-side boxplots of tax rates by gender. Choose the correct graph below. Survey Results OA. ОВ. A 10 20 30 40 10 20 30 40 M Oc OD 40 40...
 3. Listed below are sorted braking reaction times in 1 / 10,000 sec) for male and female subjects (based on data from the RT-2S Brake Reaction Time Tester), also listed in the Excel file: Brake Reaction Time.rlsr. Male 28 30 31 34 34 36 38 38 38 38 39 40 40 40 40 41 41 41 | 42| 42| 40| 46 | 47 | 48 | 48 | 49 51 53 54 56 66 67 60 61 | 61 |...
 a)
b)
Salary information regarding two independent random samples of male and female employees of a large company is shown below. Male Female 64 36 Sample size Sample mean salary (in $1000s) Population variance 44 41 128 72 If you are interested in testing whether the average salary of males is significantly greater than that of females, what is the null hypothesis? O Ho: male < female Ho male > female Ho: male > female None of the answers is...
a)
b)
Salary information regarding two independent random samples of male and female employees of a large company is shown below. Male Female 64 36 Sample size Sample mean salary (in $1000s) Population variance 44 41 128 72 If you are interested in testing whether the average salary of males is significantly greater than that of females, what is the null hypothesis? O Ho: male < female Ho male > female Ho: male > female None of the answers is...
 QUESTION 1 Salary information regarding two independent random samples of male and female employees of a large company is shown below. Male Female 36 41 72 Sample size 64 Sample mean salary (in44 S1000s) Population variance 128 The point estimate of the difference between the means of the two populations (Male - Female) is -28 4 -4 Refer to Question 1. The standard error for the difference between the two means is_ 4 7.46 4.24 2.0 Refer to Question 1...
 Do women feel differently from men when it comes to tax rates? One question on a survey of randomly selected adults asked, "What percent of income do you believe individuals should pay in income tax?" Complete parts a) through c). Click the icon to view the survey results. a) Draw side-by-side boxplots of tax rates by gender. Choose the correct graph below. Survey Results OA. ОВ. A 10 20 30 40 10 20 30 40 M Oc OD 40 40...
Most questions answered within 3 hours.
-
The average length of time between arrivals at a turnpike
toll-booth is 26 seconds. What is...
asked 1 hour ago -
(a) A piston at 6.1 atm contains a gas that occupies a volume of
3.5 L....
asked 2 hours ago -
Please answer true or false. Words
cannot be changed or added in to make it true...
asked 2 hours ago -
An empty test tube weighs 15.923 grams. Then,
MgCl2•6H2O is added into the test tube. After...
asked 2 hours ago -
Assume memory access is 10 units of time and disk access is
10000 units of time....
asked 2 hours ago -
1. Are all good samples random?
2. Magazines often report surveys giving statistics such as “63%...
asked 2 hours ago -
Under all the various types of market structures, firms
must eventually earn some economic profits for...
asked 2 hours ago -
Consider the following fitness regime for a single locus trait
with two co-dominant alleles: w11 =...
asked 2 hours ago -
A large cable company reports the following.
80% of its customers subscribe to its cable TV...
asked 3 hours ago -
Please answer the question in brief.
Discuss the role of ERP in organizations. Are ERP tools...
asked 2 hours ago -
Discuss the pros and cons of collaborative software such
as SameTime. Does it increase productivity? What...
asked 3 hours ago -
Buying your in-laws a gift because it’s expected is
due to the ____________ motive of gift-giving....
asked 3 hours ago