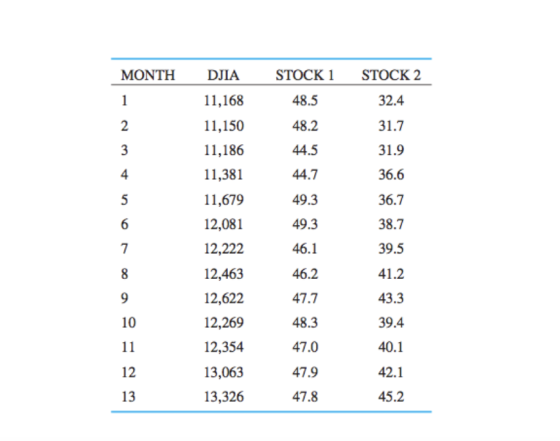
Question 1) Predict DJIA (DV) based on the prices of STOCK 1 and STOCK 2 (IVs) using multiple regression analysis
Homework Answers
1.
We do it excel:
enter data > data > analyse > data analysis > regression > enter DJIA as y and enter stocks as X > select all plots > OK
| SUMMARY OUTPUT | |||||||
| Regression Statistics | |||||||
| Multiple R | 0.963342008 | Correlation | |||||
| R Square | 0.928027825 | coeff of determination i.e., stocks explain 92.8% variability in DJIA | |||||
| Adjusted R Square | 0.91363339 | ||||||
| Standard Error | 211.8373579 | ||||||
| Observations | 13 | ||||||
| ANOVA | |||||||
| df | SS | MS | F | Significance F | |||
| Regression | 2 | 5786307.03 | 2893154 | 64.47129 | 1.93118E-06 | <0.05 (significant) | |
| Residual | 10 | 448750.6618 | 44875.07 | ||||
| Total | 12 | 6235057.692 | |||||
| Coefficients | Standard Error | t Stat | P-value | Lower 95% | Upper 95% | ||
| Intercept | 4599.576017 | 1877.488945 | 2.449855 | 0.034266 | 416.2699549 | 8782.88208 | <0.05 (significant) |
| Stock1 | 29.6692056 | 39.44522678 | 0.752162 | 0.469288 | -58.22023672 | 117.5586479 | >0.05 (insignificant) |
| Stock2 | 158.1959016 | 14.2034776 | 11.13783 | 5.87E-07 | 126.5485814 | 189.8432219 | <0.05 (significant) |
Equation: DJIA = 4599.58 + 29.669 Stock1 + 158.196 Stock2
Plots:

The DJIA is approximately normal

No significant relationship

Signficant linear relationship
Please rate my answer and comment for doubt.
Add Answer to:
Question 1) Predict DJIA (DV) based on the prices of STOCK 1 and
STOCK 2 (IVs)...
A gardener plants 300 sunflower seeds (of a brand called KwikGrow) and, after 2 weeks, measures...
A gardener plants 300 sunflower seeds (of a brand called KwikGrow) and, after 2 weeks, measures the seedlings’ heights (in mm). These heights are recorded below. He is interested in testing whether the mean height of sunflowers grown from KwikGrow seeds is greater than 33 mm two weeks after planting. He decides to conduct a hypothesis test by assuming that the sampling distribution of the sample mean has a normal distribution. For the purposes of this question, you may assume...
Most questions answered within 3 hours.
-
What is facilitated diffusion and how does it differ from
symport and antiport transportation? How do...
asked 13 minutes ago -
if a firm producing 100 units at $5.00 each experience
an 80% experience curve, what will...
asked 49 minutes ago -
A solid, uniform disk of radius 0.250 m and mass 53.7 kg rolls
down a ramp...
asked 3 hours ago -
Given the following table of high speed internet access vs.
annual home income:
Home Income
%...
asked 3 hours ago -
A baseball batter hits a 0.145kg baseball straight up into the
air. The baseball leaves the...
asked 4 hours ago -
An FM modulator is tested using
single-tone baseband signal with frequency of 50kHz and a sprectrum...
asked 4 hours ago -
Write the ionic equations for the first stage of salts
hydrolysis.
Anion, Cation?
Na2S
NiSO4
K2SO4...
asked 6 hours ago -
suppose there is a normally distributed population with a mean of
250 and a standard deviation...
asked 6 hours ago -
Question Three
Suppose you as project manager are using the Waterfall
development methodology on a large...
asked 7 hours ago -
Which statement is not true about welfare in Canada?
A.Benefits typically vary based on one's ability...
asked 8 hours ago -
Please help me with FLOWCHART and UML diagram for class,
thank you!
#include <iostream>
#include <fstream>...
asked 9 hours ago -
3. Describe the “logic circuit” of the Lac operon. Which
proteins are bound or not to...
asked 9 hours ago