
Homework Answers
Add Answer to:
SAT scores: Scores on the math SAT are normally distributed. A sample of 11 SAT scores...
Scores on the math SAT are normally distributed. A sample of 20 SAT scores had standard...
Scores on the math SAT are normally distributed. A sample of 20 SAT scores had standard deviation s = 86. Construct a 98% confidence interval for the population standard deviation σ. Round the answers to two decimal places. The 98% confidence interval is
QUESTION 3 Math SAT Question 3 The scores of men on the math SAT follow a...
 QUESTION 3 Math SAT Question 3 The scores of men on the math SAT follow a Normal distribution so do those of women. It is reasonable to assume that the standard deviations of the two sets of scores are equal. Let us (respectively, u2) denote the average math SAT score of men (respectively, women). A random sample of 20 men was selected. The average math SAT score of the men selected was 607.8 with a standard deviation of 48.76. Another...
Assume math scores on the SAT are normally distributed with a mean of 500 and a standard deviation of 100.
Assume math scores on the SAT are normally distributed with a mean of 500 and a standard deviation of 100. a. What is the probability that one randomly selected individual taking the sat will have a Math score of more than 530? b. What is the probability that one randomly selected individual taking the SAT will have a Math score between 450 and 600?c. Find the 60th percentile of these scores.
C) COMPUTE THE TEST STATISTIC D ) DETERMINE WHETHER TO REJECT OR NOT e ) STATE...
 C) COMPUTE THE TEST STATISTIC
D ) DETERMINE WHETHER TO REJECT OR NOT
e ) STATE A CONCLUSION IF THERE IS ENOUGH EVIDENCE TO SUPPORT
THE STANDARD DEVIATION OF THE IQ SCORES OF 25
IQ scores: Scores on an IQ test are normally distributed. A sample of 25 IQ scores had standard deviation s = 8. The developer of the test claims that the population standard deviation is less than o = 10. Do these data provide sufficient evidence to...
C) COMPUTE THE TEST STATISTIC
D ) DETERMINE WHETHER TO REJECT OR NOT
e ) STATE A CONCLUSION IF THERE IS ENOUGH EVIDENCE TO SUPPORT
THE STANDARD DEVIATION OF THE IQ SCORES OF 25
IQ scores: Scores on an IQ test are normally distributed. A sample of 25 IQ scores had standard deviation s = 8. The developer of the test claims that the population standard deviation is less than o = 10. Do these data provide sufficient evidence to...
Do students tend to improve their Math SAT scores the second time they take the test?...
Do students tend to improve their Math SAT scores the second time they take the test? We take a random sample of 100 hundred students who took the test twice. The mean score and the standard deviation of these 100 students on the first try are 500 and 90 respectively; the mean score and the standard deviation of these 100 students on the second try are 530 and 92 respectively. We also examine the change in Math SAT score (second...
The College Board provided comparisons of Scholastic Aptitude Test (SAT) scores based on the highest level...
The College Board provided comparisons of Scholastic Aptitude Test (SAT) scores based on the highest level of education attained by the test taker's parents. A research hypothesis was that students whose parents had attained a higher level of education would on average score higher on the SAT. The overall mean SAT math score was 514. SAT math scores for independent samples of students follow. The first sample shows the SAT math test scores for students whose parents are college graduates...
Math SAT Scores (Raw Data, Software Required): Suppose the national mean SAT score in mathematics is...
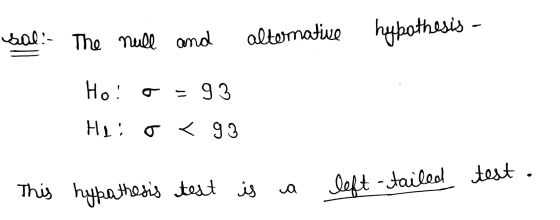
Math SAT Scores (Raw Data, Software Required): Suppose the national mean SAT score in mathematics is 510. The scores from a random sample of 40 graduates from Stevens High are given in the table below. Use this data to test the claim that the mean SAT score for all Stevens High graduates is the same as the national average. Test this claim at the 0.05 significance level. (a) What type of test is this? This is a left-tailed test. This...
Eleanor scores 680 on the mathematics part of the SAT. The distribution of SAT math scores...
 Eleanor scores 680 on the mathematics part of the SAT. The distribution of SAT math scores in recent years has been Normal with mean 563 and standard deviation 111. Gerald takes the ACT Assessment mathematics test and scores 27. ACT math scores are Normally distributed with mean 22.7 and standard deviation 2.1. a. What is Elanor's standardized score? Round to 2 decimal places. b. What is Gerald's standardized score? Round to 2 decimal places. c. Assuming that both tests measure...
The combined math and verbal scores for females taking the SAT-I test are normally distributed with...
The combined math and verbal scores for females taking the SAT-I test are normally distributed with a mean of 900 and a standard deviation of 200. If a college includes a minimum score of 850 among its requirements, what percentage of females do not satisfy that requirement?
The combined math and verbal scores for females taking the SAT-I test are normally distributed with...
The combined math and verbal scores for females taking the SAT-I test are normally distributed with a mean of 998 and a standard deviation of 202 (based on date from the College Board). If a college includes a minimum score of 850 among its requirements, what percentage of females do not satisfy that requirement?
 QUESTION 3 Math SAT Question 3 The scores of men on the math SAT follow a Normal distribution so do those of women. It is reasonable to assume that the standard deviations of the two sets of scores are equal. Let us (respectively, u2) denote the average math SAT score of men (respectively, women). A random sample of 20 men was selected. The average math SAT score of the men selected was 607.8 with a standard deviation of 48.76. Another...
 C) COMPUTE THE TEST STATISTIC
D ) DETERMINE WHETHER TO REJECT OR NOT
e ) STATE A CONCLUSION IF THERE IS ENOUGH EVIDENCE TO SUPPORT
THE STANDARD DEVIATION OF THE IQ SCORES OF 25
IQ scores: Scores on an IQ test are normally distributed. A sample of 25 IQ scores had standard deviation s = 8. The developer of the test claims that the population standard deviation is less than o = 10. Do these data provide sufficient evidence to...
C) COMPUTE THE TEST STATISTIC
D ) DETERMINE WHETHER TO REJECT OR NOT
e ) STATE A CONCLUSION IF THERE IS ENOUGH EVIDENCE TO SUPPORT
THE STANDARD DEVIATION OF THE IQ SCORES OF 25
IQ scores: Scores on an IQ test are normally distributed. A sample of 25 IQ scores had standard deviation s = 8. The developer of the test claims that the population standard deviation is less than o = 10. Do these data provide sufficient evidence to...
 Eleanor scores 680 on the mathematics part of the SAT. The distribution of SAT math scores in recent years has been Normal with mean 563 and standard deviation 111. Gerald takes the ACT Assessment mathematics test and scores 27. ACT math scores are Normally distributed with mean 22.7 and standard deviation 2.1. a. What is Elanor's standardized score? Round to 2 decimal places. b. What is Gerald's standardized score? Round to 2 decimal places. c. Assuming that both tests measure...
Most questions answered within 3 hours.
-
Under all the various types of market structures, firms
must eventually earn some economic profits for...
asked 1 second from now -
Consider the following fitness regime for a single locus trait
with two co-dominant alleles: w11 =...
asked 4 minutes ago -
A large cable company reports the following.
80% of its customers subscribe to its cable TV...
asked 20 minutes ago -
Please answer the question in brief.
Discuss the role of ERP in organizations. Are ERP tools...
asked 5 minutes ago -
Discuss the pros and cons of collaborative software such
as SameTime. Does it increase productivity? What...
asked 18 minutes ago -
1. Are all good samples random?
2. Magazines often report surveys giving statistics such as “63%...
asked 13 minutes ago -
Buying your in-laws a gift because it’s expected is
due to the ____________ motive of gift-giving....
asked 21 minutes ago -
Calculate the expected value, the variance, and the standard
deviation of the given random variable X....
asked 1 hour ago -
A hospital performs 100 surgeries per week. The probability that
complications after surgery occur is 10%....
asked 1 hour ago -
1 point) Given the significance level α=0.01 find the following:
(a) left-tailed z value z= (b)...
asked 1 hour ago -
Assuming you are the head of the software development unit at
Cyber.Soft, explain and justify why...
asked 28 minutes ago -
Magnesium and nitrogen react in a combination reaction to
produce magnesium nitride. 3 Mg + N2...
asked 36 minutes ago