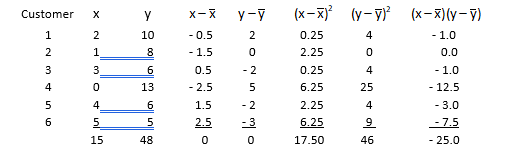
Most restaurants offer free refills for their customers who purchase a fountain soft drink. A certain buffet restaurant currently doesn’t. But, it has been argued that customers who drink more soft drinks tend to eat less and, thus, cost the restaurant less for the food the customer eats. To test this argument, this restaurant offered free refills to a sample of 6 of its customers. The total number of glasses each customer drank, X, and the $ cost of the food each ate, Y, were recorded. The findings along with some additional calculations appear in the following table.
Using the above results, determine the following. (Show your work and highlight your final answers either with a highlighter or by placing a box around it. Calculate all values to 4 decimal places.)
- The standard deviation of Y
- The standard deviation of X
- The correlation coefficient between X and Y
- The slope of the regression line expressing the linear relationship between cost and number of glasses
- The y-intercept of this regression line
- R2
Homework Answers
Solution :
a) The standard deviation of X is given by,

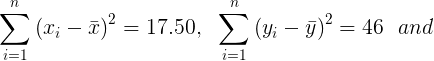
From the given table we have,
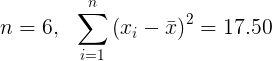


The standard deviation of X is 1.8708.
b) The standard deviation of Y is given by,

From the given table we have,


The standard deviation of Y is 3.0332.
c) The correlation coefficient between X and Y is given as follows :

From the given table we have,
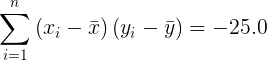
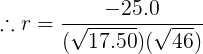

The correlation coefficient between X and Y is -0.8811.
d) Let y = a + bx be the regression equation expressing the linear relationship between cost and number of glasses.
According to principle of least square, the estimate of the slope of regression line (b) is given as follows :

From the given table we have,


The slope of the regression line expressing the linear relationship between cost and number of glasses is -1.4286.
e) The y-intercept of regression line is given as follows :


From the given table we have,
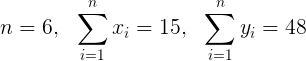

Also we have, b = -1.4286


The y-intercept of the regression line is 11.5714.
f) We have, R = -0.8811
Hence, R² = (-0.8811)² = 0.7764
R² = 0.7764
Please rate the answer. Thank you.
Add Answer to:
Most restaurants offer free refills for their customers who
purchase a fountain soft drink. A certain...
Question Cont'd X 1 2 0.0 Most restaurants offer free refills for its customers who purchase...
 Question Cont'd
X 1 2 0.0 Most restaurants offer free refills for its customers who purchase a fountain soft drink. A certain buffet restaurant currently doesn't. But, it has been argued that customers who drink more soft drinks tend to eat less and, thus, cost the restaurant less for the meal the customer eats. To test this argument, this restaurant offered free refills to a sample of 6 of its customers. The total number of glasses each customer drank, X,...
Question Cont'd
X 1 2 0.0 Most restaurants offer free refills for its customers who purchase a fountain soft drink. A certain buffet restaurant currently doesn't. But, it has been argued that customers who drink more soft drinks tend to eat less and, thus, cost the restaurant less for the meal the customer eats. To test this argument, this restaurant offered free refills to a sample of 6 of its customers. The total number of glasses each customer drank, X,...
2. The fill volume of soft-drink beverage bottles is measured by placing a gauge over the crown a...
 2. The fill volume of soft-drink beverage bottles is measured by placing a gauge over the crown and comparing the height of the liquid in the neck of the bottle against a coded scale. On this scale, a reading for zero corresponds to the correct fill height. Fifteen samples of size n 10 have been analyzed, and the fill heights are shown in Table 2. Table 2. Fill Height Data and Xbar, R. s Statistics Computed Sample x1 x4 x5...
The Burger Dome waiting line model studies the waiting time of customers at its fast-food restaurant....
 The Burger Dome waiting line model studies the waiting time of customers at its fast-food restaurant. Burger Dome's single-server waiting line system has an arrival rate of 0.75 customers per minute and a service rate of 1 customer per minute. Adapt the Black Sheep Scarves spreadsheet shown below to simulate the operation of this waiting line. Make sure to use the random values for both interarrival and service times generated in the worksheet_12-23. Assuming that customer arrivals follow a Poisson...
Page 10 of 11 Psyc2F23 F/W 19/20 Initials student ID Please answer questions B3, B4 B5...
 Page 10 of 11 Psyc2F23 F/W 19/20 Initials student ID Please answer questions B3, B4 B5 and B6 in booklet ONE. If you require an extra bonus label them IA and 1B and indicate which questions are in which booklet. B6. Your favourite hockey team, the Toronto Maple Leafs have recently fired their head Mike Babcock after losing the last few games. Looking back on the previous 10 games, y have noticed the players on the Leafs have not been...
The table below gives the number of hours seven randomly selected students spent studying and their...
 The table below gives the number of hours seven randomly selected students spent studying and their corresponding midterm exam grades. Using this data, consider the equation of the regression line, û = bo + b x, for predicting the midterm exam grade that a student will earn based on the number of hours spent studying. Keep in mind, the correlation coefficient may or may not be statistically significant for the data given. Remember, in practice, it would not be appropriate...
The table below gives the number of hours ten randomly selected students spent studying and their...
 The table below gives the number of hours ten randomly selected students spent studying and their corresponding midterm exam grades. Using this data, consider the equation of the regression line, y = bo + b1x, for predicting the midterm exam grade that a student will earn based on the number of hours spent studying. Keep in mind, the correlation coefficient may or may not be statistically significant for the data given. Remember, in practice, it would not be appropriate to...
practice nutrition assesment AC is a 42 year-old white female who recently attended a nutrition counseling...
 practice nutrition assesment
AC is a 42 year-old white female who recently attended a nutrition counseling session provided at her workplace as part of a new benefit. She states her reason for counseling as wanting to know if there is anything she can do to help prevent getting breast cancer like her mother had. She adds that her job is very stressful and demanding and that she has little extra time. She received a recent diagnosis of hypertension and was...
practice nutrition assesment
AC is a 42 year-old white female who recently attended a nutrition counseling session provided at her workplace as part of a new benefit. She states her reason for counseling as wanting to know if there is anything she can do to help prevent getting breast cancer like her mother had. She adds that her job is very stressful and demanding and that she has little extra time. She received a recent diagnosis of hypertension and was...
Consider 7075-T6 aluminum with fatigue crack growth in Table 16. Consider 7075-T6 aluminum with fatigue crack...
 Consider 7075-T6 aluminum with fatigue crack growth in
Table
16. Consider 7075-T6 aluminum with fatigue crack growth properties as given in Table 6.3. Assuming that 1=0.5 in the Walker equation, @. estimate da/dN versus AK equations in the form of Eq. 6.22a for R=0.4 and 0.8. 6. plot the equations from (a) on a log-log scale along with the R=0 equation. Keep in mind the proper region I limits of the equation. 169x10-5 ©. For a given AK, by what...
Consider 7075-T6 aluminum with fatigue crack growth in
Table
16. Consider 7075-T6 aluminum with fatigue crack growth properties as given in Table 6.3. Assuming that 1=0.5 in the Walker equation, @. estimate da/dN versus AK equations in the form of Eq. 6.22a for R=0.4 and 0.8. 6. plot the equations from (a) on a log-log scale along with the R=0 equation. Keep in mind the proper region I limits of the equation. 169x10-5 ©. For a given AK, by what...
Case: Review Medical Nutrition Therapy: A Case Study Approach - Case 6 Heart Failure with Resulting...
 Case: Review Medical Nutrition Therapy: A Case Study Approach - Case 6 Heart Failure with Resulting Cardiac Cachexia. Reviewing chapter 13 of Nutrition Therapy and Pathophysiology will also help you to understand the disease and pathophysiology of this case. 1. Calculate Mrs. Maney's energy and protein requirements. Show your calculations and explain your rationale for the formula you chose for your calculations. (15 points) 2. The MD consults the RDN for nutrition assessment and enteral feeding recommendations. Do you feel...
 Question Cont'd
X 1 2 0.0 Most restaurants offer free refills for its customers who purchase a fountain soft drink. A certain buffet restaurant currently doesn't. But, it has been argued that customers who drink more soft drinks tend to eat less and, thus, cost the restaurant less for the meal the customer eats. To test this argument, this restaurant offered free refills to a sample of 6 of its customers. The total number of glasses each customer drank, X,...
Question Cont'd
X 1 2 0.0 Most restaurants offer free refills for its customers who purchase a fountain soft drink. A certain buffet restaurant currently doesn't. But, it has been argued that customers who drink more soft drinks tend to eat less and, thus, cost the restaurant less for the meal the customer eats. To test this argument, this restaurant offered free refills to a sample of 6 of its customers. The total number of glasses each customer drank, X,...
 2. The fill volume of soft-drink beverage bottles is measured by placing a gauge over the crown and comparing the height of the liquid in the neck of the bottle against a coded scale. On this scale, a reading for zero corresponds to the correct fill height. Fifteen samples of size n 10 have been analyzed, and the fill heights are shown in Table 2. Table 2. Fill Height Data and Xbar, R. s Statistics Computed Sample x1 x4 x5...
 The Burger Dome waiting line model studies the waiting time of customers at its fast-food restaurant. Burger Dome's single-server waiting line system has an arrival rate of 0.75 customers per minute and a service rate of 1 customer per minute. Adapt the Black Sheep Scarves spreadsheet shown below to simulate the operation of this waiting line. Make sure to use the random values for both interarrival and service times generated in the worksheet_12-23. Assuming that customer arrivals follow a Poisson...
 Page 10 of 11 Psyc2F23 F/W 19/20 Initials student ID Please answer questions B3, B4 B5 and B6 in booklet ONE. If you require an extra bonus label them IA and 1B and indicate which questions are in which booklet. B6. Your favourite hockey team, the Toronto Maple Leafs have recently fired their head Mike Babcock after losing the last few games. Looking back on the previous 10 games, y have noticed the players on the Leafs have not been...
 The table below gives the number of hours seven randomly selected students spent studying and their corresponding midterm exam grades. Using this data, consider the equation of the regression line, û = bo + b x, for predicting the midterm exam grade that a student will earn based on the number of hours spent studying. Keep in mind, the correlation coefficient may or may not be statistically significant for the data given. Remember, in practice, it would not be appropriate...
 The table below gives the number of hours ten randomly selected students spent studying and their corresponding midterm exam grades. Using this data, consider the equation of the regression line, y = bo + b1x, for predicting the midterm exam grade that a student will earn based on the number of hours spent studying. Keep in mind, the correlation coefficient may or may not be statistically significant for the data given. Remember, in practice, it would not be appropriate to...
 practice nutrition assesment
AC is a 42 year-old white female who recently attended a nutrition counseling session provided at her workplace as part of a new benefit. She states her reason for counseling as wanting to know if there is anything she can do to help prevent getting breast cancer like her mother had. She adds that her job is very stressful and demanding and that she has little extra time. She received a recent diagnosis of hypertension and was...
practice nutrition assesment
AC is a 42 year-old white female who recently attended a nutrition counseling session provided at her workplace as part of a new benefit. She states her reason for counseling as wanting to know if there is anything she can do to help prevent getting breast cancer like her mother had. She adds that her job is very stressful and demanding and that she has little extra time. She received a recent diagnosis of hypertension and was...
 Consider 7075-T6 aluminum with fatigue crack growth in
Table
16. Consider 7075-T6 aluminum with fatigue crack growth properties as given in Table 6.3. Assuming that 1=0.5 in the Walker equation, @. estimate da/dN versus AK equations in the form of Eq. 6.22a for R=0.4 and 0.8. 6. plot the equations from (a) on a log-log scale along with the R=0 equation. Keep in mind the proper region I limits of the equation. 169x10-5 ©. For a given AK, by what...
Consider 7075-T6 aluminum with fatigue crack growth in
Table
16. Consider 7075-T6 aluminum with fatigue crack growth properties as given in Table 6.3. Assuming that 1=0.5 in the Walker equation, @. estimate da/dN versus AK equations in the form of Eq. 6.22a for R=0.4 and 0.8. 6. plot the equations from (a) on a log-log scale along with the R=0 equation. Keep in mind the proper region I limits of the equation. 169x10-5 ©. For a given AK, by what...
 Case: Review Medical Nutrition Therapy: A Case Study Approach - Case 6 Heart Failure with Resulting Cardiac Cachexia. Reviewing chapter 13 of Nutrition Therapy and Pathophysiology will also help you to understand the disease and pathophysiology of this case. 1. Calculate Mrs. Maney's energy and protein requirements. Show your calculations and explain your rationale for the formula you chose for your calculations. (15 points) 2. The MD consults the RDN for nutrition assessment and enteral feeding recommendations. Do you feel...
Most questions answered within 3 hours.
-
what process occurs to form microspores and megaspores in flowering
plants?
asked 4 minutes ago -
C++
I need to use the function getData to put in all my data using
arrays....
asked 4 minutes ago -
A block is hung by a string from the inside roof of a van. When
the...
asked 10 minutes ago -
Do you think companies should not go for long term debt in their
capital structure to...
asked 19 minutes ago -
I create an address book where the user enters the name, phone
and email in the...
asked 25 minutes ago -
The production capacity for acrylonitrile
(C3H3N) in the United States exceeds 2
million pounds per year....
asked 33 minutes ago -
explain and comment out your answer
43. How many address lines are required to address a...
asked 39 minutes ago -
A sample of 45 observations is selected from a normal
population. The sample mean is 49,...
asked 54 minutes ago -
A construction company is planning to bid on a building
contract. The bid costs the company...
asked 51 minutes ago -
A firm operating in a purely competitive environment is faced
with a market price of $250....
asked 58 minutes ago -
•Let’s say someone claims the average population size is
600 feet squared and the housing authority...
asked 1 hour ago -
Cynaide is a deadly poison that blocks the last step in the
electron transport chain of...
asked 1 hour ago