
Homework Answers
Qus : find the coefficient of determination and coefficient of non determination?
Solution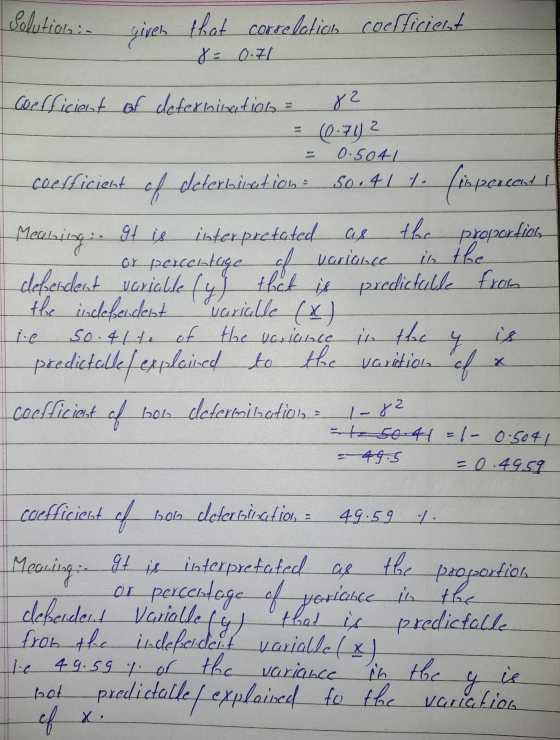
Add Answer to:
Question 3 of 14 (1 point) 10.3 Section Exercise 8 Given r = 0.71, find the...
Question 4 of 14 (1 point) 10.3 Section Exercise 10 Given r = 0.63, find the...
 Question 4 of 14 (1 point) 10.3 Section Exercise 10 Given r = 0.63, find the coefficients of determination and nondetermination and explain the meaning of each. The coefficient of determination is 7% of the variation of y is (select) to the variation of x. The coefficient of nondetermination is % of the variation of y is (select) to the variation of x.
Question 5 of 14 (1 point) 10.3 Section Exercise 12 Given r = 0.28, find the...
 Question 5 of 14 (1 point) 10.3 Section Exercise 12 Given r = 0.28, find the coefficients of determination and nondetermination and explain the meaning of each. The coefficient of determination is 1% of the variation of y is (select) to the variation of x. The coefficient of nondetermination is % of the variation of y is (select) to the variation of x.
Question 8 of 14 (1 point) View problem in a pop-up 10.3 Section Exercise The director...
 Question 8 of 14 (1 point) View problem in a pop-up 10.3 Section Exercise The director of an alumni association for a small college wants to determine whether there is any type of relationship between the amount of an alumnus's contribution (in dollars) and the number of years the alumnus has been out of school. The data follow. The regression line equation is y'= 548.276 - 78.017x. The correlation coefficient is r = -0.977. Compute the standard error of the...
Question 5 of 32 (1 point) View problem in a pop-up 10.2 Section Exercise 14a,b. Number...
 Question 5 of 32 (1 point) View problem in a pop-up 10.2 Section Exercise 14a,b. Number of fires x 47 84 62 57 72 69 58 Number of acres burned y 44 81 59 54 69 66 55 Source: National Interagency Fire Center. Download Data Part 1 The correlation coefficient for the data is r = 1 and a = 0.05. Should regression analysis be done? The regression analysis should be done. Part 2 out of 3 Find the equation...
Previous Next Question 4 of 19 (1 point) 6.1 Section Exercise 14 Find the area under...
 Previous Next Question 4 of 19 (1 point) 6.1 Section Exercise 14 Find the area under the standard normal distribution curve to the left of z-0.79.Use Table E and enter the answer to 4 decimal places. The area to the left of the z value is O C 5 6 7 8 9 0 7
Question 3 of 8 (1 point) 6.3 Section Exercise 9-14 (ca Below, n is the sample...
 Question 3 of 8 (1 point) 6.3 Section Exercise 9-14 (ca Below, n is the sample size, p is the population proportion and is the sample proportion. Use the Central Limit Theorem and the Tl-84 calculator to find the probability. Round the answer to four decimal places. n=111 p = 0.54 P 0.50)- in apop-Up Question 4 of 8 (1 point) View problem | A poll agency reports that 64% of teenagers aged 12-17 own smartphones. A random sample of...
Previous 1 2 3 4 5 6 7 Next Question 6 of 7 (1 point) View...
 Previous 1 2 3 4 5 6 7 Next Question 6 of 7 (1 point) View problem in a pop-up Numbers (in thousands) of forest fires over the year and the number (in hundred thousands) of acres burned for 7 recent years are shown. The regression line equation is y -36.9139+ 0.48904r. The correlation coefficient is 0.999. Compute the standard error of the estimate, if appropriate. Assume a -0.05. 10.3 Section Exercise 16 Number of fires x 84 62 57...
eBook DE MATH Hosted by ALEKS Corp Section 10.3 Previous 1 2 3 6 6 7...
 eBook DE MATH Hosted by ALEKS Corp Section 10.3 Previous 1 2 3 6 6 7 INN > Next Question 5 of 7 (2 points) View problem in a pop- 10.3 Section Exercise 18 Data for per capita state debt and per capita state tax for nine randomly selected states are shown. The correlation coefficient isr -0.779. Compute the standard error of the estimate, if appropriate. Assume & -0.05. Question Check Answer Solve It Per capita debt x 1016 Per...
9 of 14 (1 point) View problem in a pop-up 10.3 Section Exerci Data for per...
 9 of 14 (1 point) View problem in a pop-up 10.3 Section Exerci Data for per capita state debt and per capita state tax for nine randomly selected states are shown. The correlation coefficient is r = 0.805. Compute the standard error of the estimate, if appropriate. Assume a = 0.05. 1209 5329 3691 2176 2526 2685 1962 6452 1294 Per capita debt x Per capita taxy 2353 3069 2069 1910 2203 2724 1640 3300 1905 Source: World Almanac. Download...
Question 1 of 8 (1 point) View problem in apop-up 2.1 Section Exercise 5 Find the...
 Question 1 of 8 (1 point) View problem in apop-up 2.1 Section Exercise 5 Find the class boundaries, midpoints, and widths for the class. 49-57 Part 1 out of 3 The class boundaries for the class are NEX
 Question 4 of 14 (1 point) 10.3 Section Exercise 10 Given r = 0.63, find the coefficients of determination and nondetermination and explain the meaning of each. The coefficient of determination is 7% of the variation of y is (select) to the variation of x. The coefficient of nondetermination is % of the variation of y is (select) to the variation of x.
 Question 5 of 14 (1 point) 10.3 Section Exercise 12 Given r = 0.28, find the coefficients of determination and nondetermination and explain the meaning of each. The coefficient of determination is 1% of the variation of y is (select) to the variation of x. The coefficient of nondetermination is % of the variation of y is (select) to the variation of x.
 Question 8 of 14 (1 point) View problem in a pop-up 10.3 Section Exercise The director of an alumni association for a small college wants to determine whether there is any type of relationship between the amount of an alumnus's contribution (in dollars) and the number of years the alumnus has been out of school. The data follow. The regression line equation is y'= 548.276 - 78.017x. The correlation coefficient is r = -0.977. Compute the standard error of the...
 Question 5 of 32 (1 point) View problem in a pop-up 10.2 Section Exercise 14a,b. Number of fires x 47 84 62 57 72 69 58 Number of acres burned y 44 81 59 54 69 66 55 Source: National Interagency Fire Center. Download Data Part 1 The correlation coefficient for the data is r = 1 and a = 0.05. Should regression analysis be done? The regression analysis should be done. Part 2 out of 3 Find the equation...
 Previous Next Question 4 of 19 (1 point) 6.1 Section Exercise 14 Find the area under the standard normal distribution curve to the left of z-0.79.Use Table E and enter the answer to 4 decimal places. The area to the left of the z value is O C 5 6 7 8 9 0 7
 Question 3 of 8 (1 point) 6.3 Section Exercise 9-14 (ca Below, n is the sample size, p is the population proportion and is the sample proportion. Use the Central Limit Theorem and the Tl-84 calculator to find the probability. Round the answer to four decimal places. n=111 p = 0.54 P 0.50)- in apop-Up Question 4 of 8 (1 point) View problem | A poll agency reports that 64% of teenagers aged 12-17 own smartphones. A random sample of...
 Previous 1 2 3 4 5 6 7 Next Question 6 of 7 (1 point) View problem in a pop-up Numbers (in thousands) of forest fires over the year and the number (in hundred thousands) of acres burned for 7 recent years are shown. The regression line equation is y -36.9139+ 0.48904r. The correlation coefficient is 0.999. Compute the standard error of the estimate, if appropriate. Assume a -0.05. 10.3 Section Exercise 16 Number of fires x 84 62 57...
 eBook DE MATH Hosted by ALEKS Corp Section 10.3 Previous 1 2 3 6 6 7 INN > Next Question 5 of 7 (2 points) View problem in a pop- 10.3 Section Exercise 18 Data for per capita state debt and per capita state tax for nine randomly selected states are shown. The correlation coefficient isr -0.779. Compute the standard error of the estimate, if appropriate. Assume & -0.05. Question Check Answer Solve It Per capita debt x 1016 Per...
 9 of 14 (1 point) View problem in a pop-up 10.3 Section Exerci Data for per capita state debt and per capita state tax for nine randomly selected states are shown. The correlation coefficient is r = 0.805. Compute the standard error of the estimate, if appropriate. Assume a = 0.05. 1209 5329 3691 2176 2526 2685 1962 6452 1294 Per capita debt x Per capita taxy 2353 3069 2069 1910 2203 2724 1640 3300 1905 Source: World Almanac. Download...
 Question 1 of 8 (1 point) View problem in apop-up 2.1 Section Exercise 5 Find the class boundaries, midpoints, and widths for the class. 49-57 Part 1 out of 3 The class boundaries for the class are NEX
Most questions answered within 3 hours.
-
Calculate the pH of each of the following solutions.
0.50 M HBr
3.1×10⁻⁴ M KOH
4.2×10⁻⁵...
asked 2 hours ago -
For the year ended December 31, Depot Max’s cost of merchandise
sold was $85,600. Inventory at the...
asked 2 hours ago -
Week 10 - Professional Memo Assignment
Professional Memo Assignment
Your mission for this week, should you...
asked 2 hours ago -
Write a Python program that stores the data for each
player on the team, and it...
asked 3 hours ago -
In
the last 3 months, mike never knows when he is going to get his
allowance...
asked 3 hours ago -
Is Ca(OH)2 a Bronsted base, Lewis base, or both? Why?
asked 3 hours ago -
1A- Why don’t voters complain about U.S. tariffs on imported
sugar?
Because sugar is only a...
asked 3 hours ago -
Cash Payback Period
Primera Banco is evaluating two capital investment proposals for
a drive-up ATM kiosk,...
asked 3 hours ago -
Create a button in Swift (Xcode) that will create a charge,
create a charge using Stripe's...
asked 3 hours ago -
The reaction rate of CO and NO2 in the reaction
CO(g) + NO2(g) → CO2(g) +...
asked 3 hours ago -
Imagine that a chemist puts 6.40 mol each of
C3H8 and O2 in a 1.00-L container...
asked 3 hours ago -
How much money should be invested today in order to have $8340
at the end of...
asked 3 hours ago