
Homework Answers

Add Answer to:
HW 6.2 Score: 15.8/26 16/18 answered Question 14 < > Salaries at a company are normally...
HW 6.2 Score: 15.8/26 16/18 answered X Question 17 < > Score on last try: 0...
 HW 6.2 Score: 15.8/26 16/18 answered X Question 17 < > Score on last try: 0 of 3 pts. See Details for more. > Next question Try a similar question You can retry this question below 700 800 900 1000 1100 1200 130 SAT Scores Q Use the graph above to find the following. Round to one decimal if needed. a. Out of a random sample of 83 exams, how many you would expect to be between 1110 and 1190...
HW 6.2 Due Jul 8 by 11:59pm Points 26 Submitting an external tool HW 6.2 Score:...
 HW 6.2 Due Jul 8 by 11:59pm Points 26 Submitting an external tool HW 6.2 Score: 14.5/26 14/18 answered Question 11 < > Find the value of Z= Zc that satisfies each statement. Round to two decimals if needed. a. P(Z <Zc) 0.31 : b. P(Z > Z) = 0.61 : c. PC - Ze <2<Zc) = 0.31 : Submit Question
HW 5.1,5.2 Score: 8.95/24 9/18 answered Done 6 vo ... Question 9 > 0/1 pt 4...
 HW 5.1,5.2 Score: 8.95/24 9/18 answered Done 6 vo ... Question 9 > 0/1 pt 4 19 Details Suppose the continuous random variable X-U(4, 16). Find the following. Round answers to two decimals if needed. a. The 32nd percentile: b. The cutoff for the top 64% of values: Submit Question
HW 13.1-13.4 Score: 8.6/29 9/23 answered Question 16 < > Compute the STS (to two decimals)...
 HW 13.1-13.4 Score: 8.6/29 9/23 answered Question 16 < > Compute the STS (to two decimals) for a comparison of two population standard deviations or variances given that: a. The sample standard deviations are 14.8 for Population 1 and 15.1 for Population 2. F= b. The sample variances are 14.8 for Population 1 and 15.1 for Population 2. F=
HW 5.1,5.2 Score: 16.95/24 15/18 answered Question 18 Suppose that tree heights in a forest are...
 HW 5.1,5.2 Score: 16.95/24 15/18 answered Question 18 Suppose that tree heights in a forest are uniformly distributed from 7 to 33 feet. Round answers to one decimal if needed. a. What is the 18th percentile for tree heights? b. What percentile is a tree 27 feet tall? c. What is the cutoff (in feet) for the tallest 18% of trees? d. Out of a random sample of 35 trees, how many would you expect to be more than 27...
Section 6.2 Graphs of the Normal Distribution Score: 10/14 11/14 answered' Question 8 Assume that the...
 Section 6.2 Graphs of the Normal Distribution Score: 10/14 11/14 answered' Question 8 Assume that the readings at freezing on a batch of thermometers are normally distributed with a mean of 0°C and a standard deviation of 1.00°C. A single thermometer is randomly selected and tested. Find the probability of obtaining a reading greater than 0.05°C. Please show your answer to 4 decimal places. Probability - Submit Question
HW 13.1-13.4 Score: 8.6/29 9/23 answered Question 15 > Compute the STS (to two decimals) for...
 HW 13.1-13.4 Score: 8.6/29 9/23 answered Question 15 > Compute the STS (to two decimals) for a comparison of two population standard deviations or variances given that: a. The sample standard deviations are 19.6 for Population 1 and 18.7 for Population 2. F= b. The sample variances are 19.6 for Population 1 and 18.7 for Population 2. Submit Question
HW4 Score: 177/340 25/34 answered Question 30 < > A particular fruit's weights are normally distributed,...
 HW4 Score: 177/340 25/34 answered Question 30 < > A particular fruit's weights are normally distributed, with a mean of 498 grams and a standard deviation of 32 grams. The heaviest 10% of fruits weigh more than how many grams? Answer = (Give your answer to the nearest gram.) Warning: Do not use the Z Normal Tables...they may not be accurate enough since WAMAP may look for more accuracy than comes from the table. Question Help: D Post to forum...
UIC.CUCUIJCOLIITILISHIC/ JUULIZI HW 4.1,4.2 Score: 15.25/18 17/18 answered X Question 15 < Score on last try:...
 UIC.CUCUIJCOLIITILISHIC/ JUULIZI HW 4.1,4.2 Score: 15.25/18 17/18 answered X Question 15 < Score on last try: 0 of 1 pts. See Details for more. > Next question Try a similar question You can retry this question below A class of 27 students took a short quiz. 3 students missed no questions, 4 missed one question, 5 missed two questions, 7 missed three questions and 8 missed four questions. Find the expected number of missed questions for a randomly chosen student...
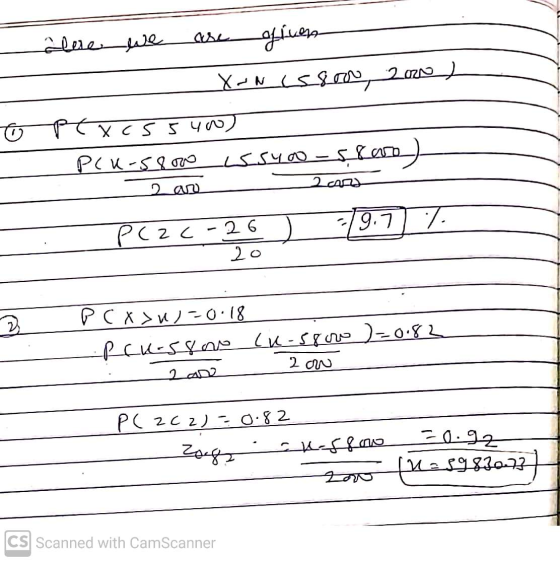
QUESTION 16 A normally distributed population of adult American men heights has a mean of 57.8...
QUESTION 16 A normally distributed population of adult American men heights has a mean of 57.8 inches and a standard deviation of 4.3 inches. Determine the sample average height at the 1st percentile for samples of size 75. Round to the nearest tenth QUESTION 17 A normally distributed population has a mean of 268 and a standard deviation of 39. Determine the value of the 90th percentile. Round to the nearest whole number QUESTION 18 A population is normally distributed...
 HW 6.2 Score: 15.8/26 16/18 answered X Question 17 < > Score on last try: 0 of 3 pts. See Details for more. > Next question Try a similar question You can retry this question below 700 800 900 1000 1100 1200 130 SAT Scores Q Use the graph above to find the following. Round to one decimal if needed. a. Out of a random sample of 83 exams, how many you would expect to be between 1110 and 1190...
 HW 6.2 Due Jul 8 by 11:59pm Points 26 Submitting an external tool HW 6.2 Score: 14.5/26 14/18 answered Question 11 < > Find the value of Z= Zc that satisfies each statement. Round to two decimals if needed. a. P(Z <Zc) 0.31 : b. P(Z > Z) = 0.61 : c. PC - Ze <2<Zc) = 0.31 : Submit Question
 HW 5.1,5.2 Score: 8.95/24 9/18 answered Done 6 vo ... Question 9 > 0/1 pt 4 19 Details Suppose the continuous random variable X-U(4, 16). Find the following. Round answers to two decimals if needed. a. The 32nd percentile: b. The cutoff for the top 64% of values: Submit Question
 HW 13.1-13.4 Score: 8.6/29 9/23 answered Question 16 < > Compute the STS (to two decimals) for a comparison of two population standard deviations or variances given that: a. The sample standard deviations are 14.8 for Population 1 and 15.1 for Population 2. F= b. The sample variances are 14.8 for Population 1 and 15.1 for Population 2. F=
 HW 5.1,5.2 Score: 16.95/24 15/18 answered Question 18 Suppose that tree heights in a forest are uniformly distributed from 7 to 33 feet. Round answers to one decimal if needed. a. What is the 18th percentile for tree heights? b. What percentile is a tree 27 feet tall? c. What is the cutoff (in feet) for the tallest 18% of trees? d. Out of a random sample of 35 trees, how many would you expect to be more than 27...
 Section 6.2 Graphs of the Normal Distribution Score: 10/14 11/14 answered' Question 8 Assume that the readings at freezing on a batch of thermometers are normally distributed with a mean of 0°C and a standard deviation of 1.00°C. A single thermometer is randomly selected and tested. Find the probability of obtaining a reading greater than 0.05°C. Please show your answer to 4 decimal places. Probability - Submit Question
 HW 13.1-13.4 Score: 8.6/29 9/23 answered Question 15 > Compute the STS (to two decimals) for a comparison of two population standard deviations or variances given that: a. The sample standard deviations are 19.6 for Population 1 and 18.7 for Population 2. F= b. The sample variances are 19.6 for Population 1 and 18.7 for Population 2. Submit Question
 HW4 Score: 177/340 25/34 answered Question 30 < > A particular fruit's weights are normally distributed, with a mean of 498 grams and a standard deviation of 32 grams. The heaviest 10% of fruits weigh more than how many grams? Answer = (Give your answer to the nearest gram.) Warning: Do not use the Z Normal Tables...they may not be accurate enough since WAMAP may look for more accuracy than comes from the table. Question Help: D Post to forum...
 UIC.CUCUIJCOLIITILISHIC/ JUULIZI HW 4.1,4.2 Score: 15.25/18 17/18 answered X Question 15 < Score on last try: 0 of 1 pts. See Details for more. > Next question Try a similar question You can retry this question below A class of 27 students took a short quiz. 3 students missed no questions, 4 missed one question, 5 missed two questions, 7 missed three questions and 8 missed four questions. Find the expected number of missed questions for a randomly chosen student...
Most questions answered within 3 hours.
-
Do not neglect the old for the new. The existing business must
not lose priority simply...
asked 2 hours ago -
Kylie is a single mom with two dependent children,
Tanner, age 7 and Olivia, age 11....
asked 3 hours ago -
Phosphorous + bromine = phosphorous tribromide. If 35.0 g of
bromine are reacted and 27.9 grams...
asked 5 hours ago -
Derive the long wavelength limit of the Planck energy density
distribution
asked 5 hours ago -
Calculate the pH of each of the following solutions.
0.50 M HBr
3.1×10⁻⁴ M KOH
4.2×10⁻⁵...
asked 8 hours ago -
For the year ended December 31, Depot Max’s cost of merchandise
sold was $85,600. Inventory at the...
asked 8 hours ago -
Week 10 - Professional Memo Assignment
Professional Memo Assignment
Your mission for this week, should you...
asked 8 hours ago -
Write a Python program that stores the data for each
player on the team, and it...
asked 8 hours ago -
In
the last 3 months, mike never knows when he is going to get his
allowance...
asked 9 hours ago -
Is Ca(OH)2 a Bronsted base, Lewis base, or both? Why?
asked 9 hours ago -
1A- Why don’t voters complain about U.S. tariffs on imported
sugar?
Because sugar is only a...
asked 9 hours ago -
Cash Payback Period
Primera Banco is evaluating two capital investment proposals for
a drive-up ATM kiosk,...
asked 9 hours ago