Please show full details steps for better understanding. Thank you.
Homework Answers
There are 6 feed suppliments on the growth of chickens
The weights are considered for all 6 feeds that is treatments.
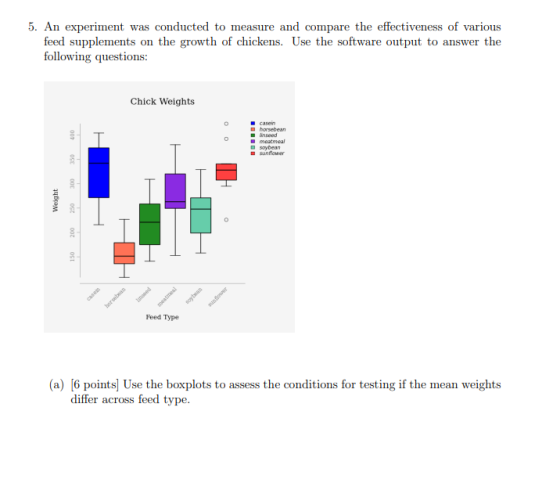
a) Using the box plot,
1. The samples taken for each suppliment are simple random samples.
2. The samples taken for each suppliment are independent on each other that is each feed type is independent on each other.
3. The populations from which the samples of feed are selected are normal.
4. The variances of the populations from which the samples are selected are equal.
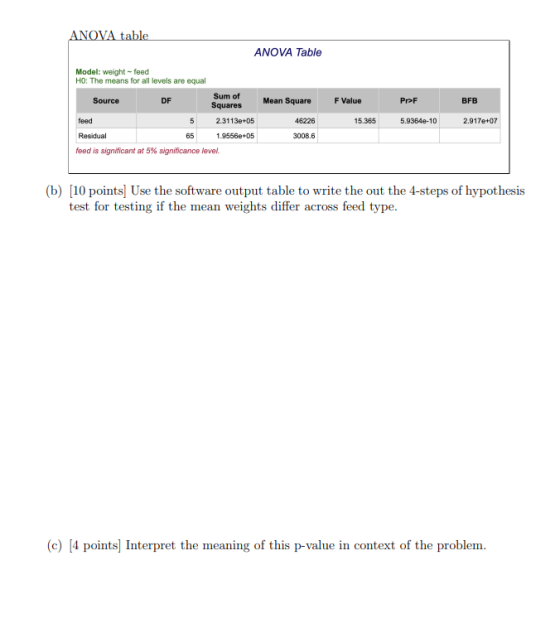
b) 4 Steps of hypothesis
1. The null and alternative hypothesis
H0: The means for all levels are equal
H1: Atleat one mean differ from the others.
2. The test statistics
Uisng the software output, the F test statistics is
F value = 15.365
3. P-value
Uisng the output,
P-value = 5.9364e-10 = 0.00000000059364
4. Decision and conclusion
Alpha is not given so it should be 0.05
If P-value > alpha then fail to reject the null hypothesis otherwise reject the null hypothesis
P-value (0.00000000059364) is less than alpha 0.05 so reject the null hypothesis.
Conclusion: Reject the null hypothesis, there is sufficient evidence to support that claim that at least one mean differs across feed type.
c) P-value
P-value is a probability of getting a value of test statistics as more as extreme than the value of test statistics computed from the data, under the assumption that the null hypothesis it true.
P-value is the smallest level of significance which lead to reject the null hypothesis.
That is if the p-value is too small then null would be rejected and if not then it would be fail to rejected.
In this case p-value is too small so it leads to reject the null hypothesis.
Add Answer to:
Please show full details steps for better understanding. Thank
you.
5. An experiment was conducted to...
5. An experiment was conducted to measure and compare the effectiveness of various feed supplements on...
 5. An experiment was conducted to measure and compare the effectiveness of various feed supplements on the growth of chickens. Use the software output to answer the following questions: Chick Weights casein horsebean Ansed meatmeal soybean sunflower O sybeat horse wanto Feed Type (a) Use the boxplots to assess the conditions for testing if the mean weights differ across feed type. ANOVA table ANOVA Table Model: weight-feed HO: The means for all levels are equal Source DF Sum of Squares...
Chicken diet and weight. In previous chapter, we compared the effects of two types of feed...
 Chicken diet and weight. In previous chapter, we compared the effects of two types of feed at a time. A better analysis would first consider all feed types at once: casein, horsebean, linseed, meat meal, soybean, and sunflower. The ANOVA output below can be used to test for differences between the average weights of chicks on different diets. DF Sum Sa Mean Sq F value Pr(>F) feed 5 231129.16 46225.83 15.36 0.0000 residuals 65195556.02 3008.55 Conduct a hypothesis test to...
Please show full details steps for better understanding. Thank you. Regression Coefficients Estimates Model formula: mpg...
 Please show full details steps for better understanding. Thank
you.
Regression Coefficients Estimates Model formula: mpg - cyl + disp + hp + am Term Coefficient Estimate Standard Error t Value (Intercept) 30.476 2.8655 10.636 cyl -0.8345 0.75709 -1.1022 disp -0.0077447 0.010716 -0.72272 Pr > It! 3.7246e-11 0.28008 0.47607 hp -0.032962 0.015614 -2.1111 0.044166 am 3.4453 1.4539 2.3697 0.025205 Model Summary: Coefficient of Determination (R-Squared) Model formula: mpg - cyl + disp + hp + am Residual Standard Error DF...
Please show full details steps for better understanding. Thank
you.
Regression Coefficients Estimates Model formula: mpg - cyl + disp + hp + am Term Coefficient Estimate Standard Error t Value (Intercept) 30.476 2.8655 10.636 cyl -0.8345 0.75709 -1.1022 disp -0.0077447 0.010716 -0.72272 Pr > It! 3.7246e-11 0.28008 0.47607 hp -0.032962 0.015614 -2.1111 0.044166 am 3.4453 1.4539 2.3697 0.025205 Model Summary: Coefficient of Determination (R-Squared) Model formula: mpg - cyl + disp + hp + am Residual Standard Error DF...
Can you please explain in simple terms the methods of this experiment? I'm having difficulty visualizing...
Can you please explain in simple terms the methods of this experiment? I'm having difficulty visualizing and understanding what is being done. I have copied and pasted some of the text from the article. Thank you! Abstract : Obesity, high-fat diets, and subsequent type 2 diabetes (T2DM) are associated with cognitive impairment. Moreover, T2DM increases the risk of Alzheimer's disease (AD) and leads to abnormal elevation of brain beta-amyloid levels, one of the hallmarks of AD. The psychoactive alkaloid caffeine...
 5. An experiment was conducted to measure and compare the effectiveness of various feed supplements on the growth of chickens. Use the software output to answer the following questions: Chick Weights casein horsebean Ansed meatmeal soybean sunflower O sybeat horse wanto Feed Type (a) Use the boxplots to assess the conditions for testing if the mean weights differ across feed type. ANOVA table ANOVA Table Model: weight-feed HO: The means for all levels are equal Source DF Sum of Squares...
 Chicken diet and weight. In previous chapter, we compared the effects of two types of feed at a time. A better analysis would first consider all feed types at once: casein, horsebean, linseed, meat meal, soybean, and sunflower. The ANOVA output below can be used to test for differences between the average weights of chicks on different diets. DF Sum Sa Mean Sq F value Pr(>F) feed 5 231129.16 46225.83 15.36 0.0000 residuals 65195556.02 3008.55 Conduct a hypothesis test to...
 Please show full details steps for better understanding. Thank
you.
Regression Coefficients Estimates Model formula: mpg - cyl + disp + hp + am Term Coefficient Estimate Standard Error t Value (Intercept) 30.476 2.8655 10.636 cyl -0.8345 0.75709 -1.1022 disp -0.0077447 0.010716 -0.72272 Pr > It! 3.7246e-11 0.28008 0.47607 hp -0.032962 0.015614 -2.1111 0.044166 am 3.4453 1.4539 2.3697 0.025205 Model Summary: Coefficient of Determination (R-Squared) Model formula: mpg - cyl + disp + hp + am Residual Standard Error DF...
Please show full details steps for better understanding. Thank
you.
Regression Coefficients Estimates Model formula: mpg - cyl + disp + hp + am Term Coefficient Estimate Standard Error t Value (Intercept) 30.476 2.8655 10.636 cyl -0.8345 0.75709 -1.1022 disp -0.0077447 0.010716 -0.72272 Pr > It! 3.7246e-11 0.28008 0.47607 hp -0.032962 0.015614 -2.1111 0.044166 am 3.4453 1.4539 2.3697 0.025205 Model Summary: Coefficient of Determination (R-Squared) Model formula: mpg - cyl + disp + hp + am Residual Standard Error DF...
Most questions answered within 3 hours.
-
You are attempting to calculate a firm’s free cash flow to
equity. You know the following...
asked 30 minutes ago -
the following reaction occurs in a balloon containing
N2O2 gas
N2O4(g)=2NO2(g)
will the volume of the...
asked 1 hour ago -
answer the questions throughout this program
public class Day implements Comparable {
Private Boolean atWork;...
asked 1 hour ago -
This is C++ code for parking fee management program
#include <iostream>
#include <iomanip>
using namespace std;...
asked 1 hour ago -
The free energy change for the following reaction at 25 °C, when
[Sn2+] = 1.17 M...
asked 3 hours ago -
An MNE is this kind of industry when competition in one country
is essentially independent of...
asked 4 hours ago -
. For this set of questions, determine what
proportion of a normal distribution is located betweeneach...
asked 5 hours ago -
A college student is employed as a door-to-door newspaper
salesman. Historical data suggests that the student...
asked 6 hours ago -
MATLAB HW 11 problem using Switch Case and Input commands
Write a script file that calculates...
asked 5 hours ago -
Considering gravitational time dilation, calculate the time that
passes in Earth’s surface while 1 hour passes...
asked 6 hours ago -
Minitab Problem: Take the Lake Hume June rainfall data and find
use the processes outlined in...
asked 7 hours ago -
X Company is trying to decide whether to continue using old
equipment to make Product A...
asked 7 hours ago