


Homework Answers
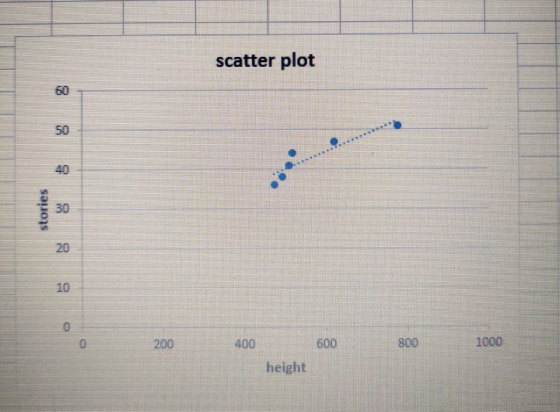
| sr.no. | height (X) | stories (Y) | X^2 | Y^2 | XY |
| 1 | 778 | 51 | 605284 | 2601 | 39678 |
| 2 | 621 | 47 | 385641 | 2209 | 29187 |
| 3 | 519 | 44 | 269361 | 1936 | 22836 |
| 4 | 510 | 41 | 260100 | 1681 | 20910 |
| 5 | 494 | 38 | 244036 | 1444 | 18772 |
| 6 | 473 | 36 | 223729 | 1296 | 17028 |
| total | 3395 | 257 | 1988151 | 11167 | 148411 |


Add Answer to:
519 Find the equation of the regression line for the given data. Then construct a scatter...
0 Find the equation of the regression line for the given data. The construct a scatter...
 0 Find the equation of the regression line for the given data. The construct a scatter plot of the date and draw the regression in (The pair of we have a significant corelation) Then use the regression equation to predict the value ofy for each of the given x-vous meaningful. The table below shows the heights on tool and the number of stories of si notable buildings in a city Helght, 775 510 500 (0) 500 fot b)x500 Stories 37...
Find the equation of the regression line for the given data. Then construct a scatter plot...
Find the equation of the regression line for the given data. Then construct a scatter plot of the data and draw the regression line. (The pair of variables have a significant correlation.) Then use the regression equation to predict the value of y for each of the given x-values, if meaningful. The table below shows the heights (in feet) and the number of stories of six notable buildings in a city. Height comma xHeight, x 764 625 520 510 492...
Find the equation of the regression line for the given data. Then construct a scater plot...
 Find the equation of the regression line for the given data. Then construct a scater plot of the data and draw the regression line (The pair of variubles have a significant comelation) Then use the regression equation to predict the vakue of y for each of the given x-values, if meaningul The table below shows the heights (in feet) and the number of shories of six notable buildings in a city 758 Height, K Stories, y 621 47 (a)490 feet...
Find the equation of the regression line for the given data. Then construct a scatter plot...
 Find the equation of the regression line for the given data. Then construct a scatter plot of the given x-values, if meaningful. The table below shows the heights (in feet) and the number of stories of Height, Stories, y data and draw the regression line. (The pair of variables have a signiicant correlation.) Then use the regression equation to predict the value of y for each of the sb. notable buildings in a city 775 53 619 47 519 46...
Find the equation of the regression line for the given data. Then construct a scatter plot...
 Find the equation of the regression line for the given data. Then construct a scatter plot of the data and draw the regression line. (The pair of variaties have a significant correlation) Then use the regression equation to predict the value of yo each of the given x-values, if meaningful. The table below shows the height in feet) and the number of stories of six notable buildings in a city Heights 772 5110 503 483 Stories 51 (a)x= 501 foot...
Find the equation of the regression line for the given data. Then construct a scatter plot...
 Find the equation of the regression line for the given data. Then construct a scatter plot of the data and draw the regression line. (The pair of variables have a significant correlation.) Then use the regression equation to predict the value of y for each of the given x-values, if meaningful. The table below shows the heights (in feet) and the number of stories of six notable buildings in a city Height, x 768 628 518 511 491 478 (a)...
Find the equation of the regression line for the given data. Then construct a scatter plot...
 Find the equation of the regression line for the given data. Then construct a scatter plot of the data and draw the regression line. (The pair of variables have a significa correlation.) Then use the regression equation to predict the value of y for each of the given x-values, if meaningful. The table below shows the heights (in feet) and the number of stories of six notable buildings in a city. Height, x 758 621 518 510 492 483 (a)...
Find the equation of the regression line for the given data. Then construct a scatter plot...
 Find the equation of the regression line for the given data. Then construct a scatter plot of the data and draw the regression line. (The pair of variables has a significant correlation.) Then use the regressiorn equation to predict the value of y for each of the given x-values, if meaningful. The table shows the shoe size and heights (in) for 6 men Shoe size: x-T8.5 110T15|130|135 (a) x=size 10 0 (b)x-size 10.5 3.5 745 725(c)x-s size 16.0 (d)x- size...
Find the equation of the regression line for the given data Then construct a cate plot...
 Find the equation of the regression line for the given data Then construct a cate plot of the data and draw the regressionline(The pair of variables have a significant correlation) Then use the regression equation to pred the value of y for each of the given x-values, if meaningful The table below shows the heights in feet) and the number of stories of she notable buildings in a city Height, 766 620 508 (a)x562 fost (h) x646 feet Stories, y...
Find the equation of the regression line for the given data. Then construct a scatter plot...
 Find the equation of the regression line for the given data. Then construct a scatter plot of the data and draw the regression line. (The pair of variables have a significant correlation.) Then use the regression equation to predict the value of y for each of the given x-values, if meaningful. The number of hours 6 students spent for a test and their scores on that test are shown below. Hours spent studying, X 2 5 5 (a) x =...
 0 Find the equation of the regression line for the given data. The construct a scatter plot of the date and draw the regression in (The pair of we have a significant corelation) Then use the regression equation to predict the value ofy for each of the given x-vous meaningful. The table below shows the heights on tool and the number of stories of si notable buildings in a city Helght, 775 510 500 (0) 500 fot b)x500 Stories 37...
 Find the equation of the regression line for the given data. Then construct a scater plot of the data and draw the regression line (The pair of variubles have a significant comelation) Then use the regression equation to predict the vakue of y for each of the given x-values, if meaningul The table below shows the heights (in feet) and the number of shories of six notable buildings in a city 758 Height, K Stories, y 621 47 (a)490 feet...
 Find the equation of the regression line for the given data. Then construct a scatter plot of the given x-values, if meaningful. The table below shows the heights (in feet) and the number of stories of Height, Stories, y data and draw the regression line. (The pair of variables have a signiicant correlation.) Then use the regression equation to predict the value of y for each of the sb. notable buildings in a city 775 53 619 47 519 46...
 Find the equation of the regression line for the given data. Then construct a scatter plot of the data and draw the regression line. (The pair of variaties have a significant correlation) Then use the regression equation to predict the value of yo each of the given x-values, if meaningful. The table below shows the height in feet) and the number of stories of six notable buildings in a city Heights 772 5110 503 483 Stories 51 (a)x= 501 foot...
 Find the equation of the regression line for the given data. Then construct a scatter plot of the data and draw the regression line. (The pair of variables have a significant correlation.) Then use the regression equation to predict the value of y for each of the given x-values, if meaningful. The table below shows the heights (in feet) and the number of stories of six notable buildings in a city Height, x 768 628 518 511 491 478 (a)...
 Find the equation of the regression line for the given data. Then construct a scatter plot of the data and draw the regression line. (The pair of variables have a significa correlation.) Then use the regression equation to predict the value of y for each of the given x-values, if meaningful. The table below shows the heights (in feet) and the number of stories of six notable buildings in a city. Height, x 758 621 518 510 492 483 (a)...
 Find the equation of the regression line for the given data. Then construct a scatter plot of the data and draw the regression line. (The pair of variables has a significant correlation.) Then use the regressiorn equation to predict the value of y for each of the given x-values, if meaningful. The table shows the shoe size and heights (in) for 6 men Shoe size: x-T8.5 110T15|130|135 (a) x=size 10 0 (b)x-size 10.5 3.5 745 725(c)x-s size 16.0 (d)x- size...
 Find the equation of the regression line for the given data Then construct a cate plot of the data and draw the regressionline(The pair of variables have a significant correlation) Then use the regression equation to pred the value of y for each of the given x-values, if meaningful The table below shows the heights in feet) and the number of stories of she notable buildings in a city Height, 766 620 508 (a)x562 fost (h) x646 feet Stories, y...
 Find the equation of the regression line for the given data. Then construct a scatter plot of the data and draw the regression line. (The pair of variables have a significant correlation.) Then use the regression equation to predict the value of y for each of the given x-values, if meaningful. The number of hours 6 students spent for a test and their scores on that test are shown below. Hours spent studying, X 2 5 5 (a) x =...
Most questions answered within 3 hours.
-
MATLAB HW 11 problem using Switch Case and Input commands
Write a script file that calculates...
asked 16 minutes ago -
A college student is employed as a door-to-door newspaper
salesman. Historical data suggests that the student...
asked 31 minutes ago -
Considering gravitational time dilation, calculate the time that
passes in Earth’s surface while 1 hour passes...
asked 55 minutes ago -
Minitab Problem: Take the Lake Hume June rainfall data and find
use the processes outlined in...
asked 1 hour ago -
X Company is trying to decide whether to continue using old
equipment to make Product A...
asked 1 hour ago -
IN PYTHON ONLY !! Program 2: Re-work
program #5 (WeeklyHours) from the previous assignment such that...
asked 2 hours ago -
The average length of time between arrivals at a turnpike
toll-booth is 26 seconds. What is...
asked 4 hours ago -
(a) A piston at 6.1 atm contains a gas that occupies a volume of
3.5 L....
asked 5 hours ago -
Please answer true or false. Words
cannot be changed or added in to make it true...
asked 5 hours ago -
An empty test tube weighs 15.923 grams. Then,
MgCl2•6H2O is added into the test tube. After...
asked 5 hours ago -
Assume memory access is 10 units of time and disk access is
10000 units of time....
asked 5 hours ago -
1. Are all good samples random?
2. Magazines often report surveys giving statistics such as “63%...
asked 5 hours ago