
Homework Answers
Add Answer to:
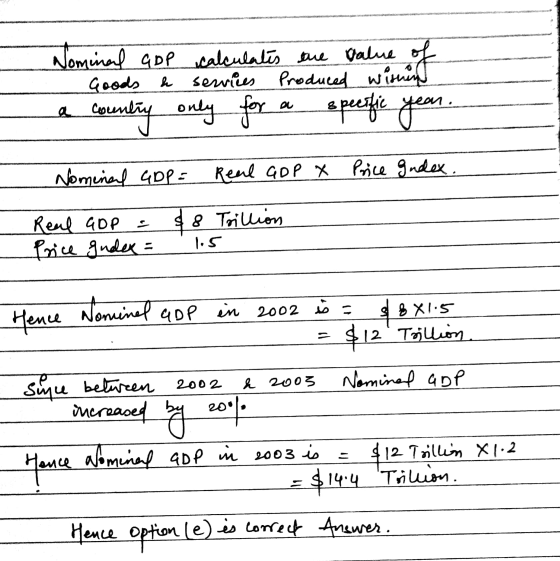
Suppose that in 2002 the real GDP was $8 trillion and the GDP price index was...
Suppose that in 2005 Real GDP was $40 billion and the GDP price index was 1.20....
 Suppose that in 2005 Real GDP was $40 billion and the GDP price index was 1.20. If nominal GDP increased by 40% between 2005 and 2006, what was Nominal GDP in 2006? Select one: a. $44.0 billion b. $48.4 billion O C. $62.9 billion O d. $67.2 billion e. $71.7 billion
2 8 25 25 The above table has the demand and supply schedules for money. Real...
 2 8 25 25 The above table has the demand and supply schedules for money. Real GDP increase s and, as a result, the demand for money t increases by $0.2 trlion at each level of the nominal A. 10 percent B. 7 percent. OC. 2 percent. D. 5 percent. C. E, 3 percent. 6. The GDP price index in the United States in 2002 was about 85, and real GDP in 2002 was 31 2.9 trillion (2009 dollars). x...
Year Nominal GDP (billions of $) Real GDP (billions of 2000 $) Price Index (2000 =...
Year Nominal GDP (billions of $) Real GDP (billions of 2000 $) Price Index (2000 = base year) Growth (%) in Real GDP from previous year 1977 2,030.9 4,750.5 42.8 6.4% 1978 2,294.7 45.8 1998 8,747.0 9,066.9 4.2% 1999 9,268.4 97.9 2000 9,817.0 9,817.0 2001 10,128.0 9,890.7 2002 10,487.0 10,074.8 104.1 2003 11,004.0 106.0 2004 11,735.0 108.3 6.What was the price index value for the US in the base year? 7.What was real GDP for the US in the year...
Suppose nominal GDP is estimated to be $5 trillion, and the GDP deflator is 150. Given...
Suppose nominal GDP is estimated to be $5 trillion, and the GDP deflator is 150. Given these numbers what is real GDP? Select one: a. $2.75 trillion b. $ 4.0 trillion c. $3.33 trillion d. $7.5 trillion
Suppose that this year's money supply is $500 billion, nominal GDP is $10 trillion and real...
Suppose that this year's money supply is $500 billion, nominal GDP is $10 trillion and real GDP is $5 trillion. a. What is the price level? b. What is the velocity of money? (Please calculate your answers in billions, i.e. leave off the zeros (0) if necessary.) c. Suppose that velocity is constant and the economy's output of goods and services rises by five percent each year. What will happen to nominal GDP and the price level next year if the Fed...
(A) Real gross domestic product (GDP) increased from $16.62 trillion to $18.05 trillion, and the price...
 (A) Real gross domestic product (GDP) increased from $16.62 trillion to $18.05 trillion, and the price level increased from 120.0 to 123.4. Rounding to the nearest second decimal, how much was the growth rate of nominal GDP? (B) A US computer company buys computers from a US company for their workers. Which category of US gross domestic product (GDP) is this included? (C, I, G, NX or none of the four) (C) Refer to the following table, compute the CPI...
1. Real gross domestic product (GDP) increased from $16.62 trillion to $18.05 trillion, and the price...
 1. Real gross domestic product (GDP) increased from $16.62 trillion to $18.05 trillion, and the price level increased from 120.0 to 123.4. Rounding to the nearest second decimal, how much was the growth rate of nominal GDP? 2 Official GDP may understate the actual output of an economy. Give one possible reason to explain this 3 The following graphs show the loanable funds market. Give an example scenario, which is represented by a shift from line 3 to line 2....
Suppose that this years money supply is $500 billion, nominal GDP is $6 trillion, and real...
Suppose that this years money supply is $500 billion, nominal GDP is $6 trillion, and real GDP is $2 trillion. a. What is the price level? What is the velocity of money? b. Suppose that velocity is constant and the economy's output of goods and services rises by 3% each year. What will happen to nominal GDP and the price level next year if the Fed keeps the money supply constant? c. What money supply should the Fed set next...
Real GDP in 2002 was $13,169 billion. Real GDP in 2003 was $12,792 billion. What was...
 Real GDP in 2002 was $13,169 billion. Real GDP in 2003 was $12,792 billion. What was the percentage change in real GDP from 2002 to 2003? What do econom call the percentage change in real GDP from one year to the next? The percentage change in real GDP from 2002 to 2003 is - %. (Round your response to one decimal place.) This percentage change in real GDP is also known as O A. the profit. O B. the marginal...
2. Suppose real GDP for the US in 2018 was $20 trillion and real GDP for...
 2. Suppose real GDP for the US in 2018 was $20 trillion and real GDP for the US in 2019 was $25 trillion. What is the value of GDP growth 2018 to 2019? A. 5% B. 20% C. 25% D. 50% E. Not enough information 3. Inflation represents: A. an increase in output. B. an increase in the aggregate price level. C. an increase in the unemployment rate. D. all of the above E. none of the above 4. Okun's...
 Suppose that in 2005 Real GDP was $40 billion and the GDP price index was 1.20. If nominal GDP increased by 40% between 2005 and 2006, what was Nominal GDP in 2006? Select one: a. $44.0 billion b. $48.4 billion O C. $62.9 billion O d. $67.2 billion e. $71.7 billion
 2 8 25 25 The above table has the demand and supply schedules for money. Real GDP increase s and, as a result, the demand for money t increases by $0.2 trlion at each level of the nominal A. 10 percent B. 7 percent. OC. 2 percent. D. 5 percent. C. E, 3 percent. 6. The GDP price index in the United States in 2002 was about 85, and real GDP in 2002 was 31 2.9 trillion (2009 dollars). x...
 (A) Real gross domestic product (GDP) increased from $16.62 trillion to $18.05 trillion, and the price level increased from 120.0 to 123.4. Rounding to the nearest second decimal, how much was the growth rate of nominal GDP? (B) A US computer company buys computers from a US company for their workers. Which category of US gross domestic product (GDP) is this included? (C, I, G, NX or none of the four) (C) Refer to the following table, compute the CPI...
 1. Real gross domestic product (GDP) increased from $16.62 trillion to $18.05 trillion, and the price level increased from 120.0 to 123.4. Rounding to the nearest second decimal, how much was the growth rate of nominal GDP? 2 Official GDP may understate the actual output of an economy. Give one possible reason to explain this 3 The following graphs show the loanable funds market. Give an example scenario, which is represented by a shift from line 3 to line 2....
 Real GDP in 2002 was $13,169 billion. Real GDP in 2003 was $12,792 billion. What was the percentage change in real GDP from 2002 to 2003? What do econom call the percentage change in real GDP from one year to the next? The percentage change in real GDP from 2002 to 2003 is - %. (Round your response to one decimal place.) This percentage change in real GDP is also known as O A. the profit. O B. the marginal...
 2. Suppose real GDP for the US in 2018 was $20 trillion and real GDP for the US in 2019 was $25 trillion. What is the value of GDP growth 2018 to 2019? A. 5% B. 20% C. 25% D. 50% E. Not enough information 3. Inflation represents: A. an increase in output. B. an increase in the aggregate price level. C. an increase in the unemployment rate. D. all of the above E. none of the above 4. Okun's...
Most questions answered within 3 hours.
-
. A 100.0 mL sample of 0.18 M HClO4 is titrated with 0.27 M
LiOH. Determine...
asked 9 minutes ago -
A regression equation that describes the relationship between
the amount of the bill ($) at a...
asked 1 hour ago -
exercise on VSEPR and molecular structrue.
octahedral
SeCl62-
TeCl62-
ClF62-
distorted
SeF62–
IF6–
asked 1 hour ago -
284 mL of a 0.52 M potassium hydroxide solution is added to 467
mL of a...
asked 1 hour ago -
Little’s Law: Val d’Costa is a world famous ski village in the
French Alps. Because of...
asked 2 hours ago -
Find the absolute error D for the calculation if A + B/C=D A=
9.4 +/- 0.4...
asked 2 hours ago -
New Air Heating and Cooling, manufactures furnaces and central
air units. The company pride itself on...
asked 2 hours ago -
A coach uses a new technique to train gymnasts. Seven
gymnasts were randomly selected and their...
asked 4 hours ago -
While rotating the tires on your car you notice a rock [mass =
0.1 Kg] stuck...
asked 6 hours ago -
Using MARS simulator, write MIPS programs according to
the following scenarios: Receive a positive integer number...
asked 8 hours ago -
An object in front of a concave mirror has a real image that is
11.5 cm...
asked 8 hours ago -
Consider the reaction, C3 H8 + O2 --> CO2 + H2O. How many
moles of O2...
asked 10 hours ago