The number of annual precipitation days for one-half of the 50 largest U.S. cities is listed...
The number of annual precipitation days for one-half of the 50 largest U.S. cities is listed below. Do the following:
131 94 136 88 116 77 127 79 47 97 116 123 88 102 27 80 156 133 117 55 112 98 55 90 125
a) Construct a frequency distribution for the data (include class boundaries in the table) with 5 classes.
b) Graph its histogram.
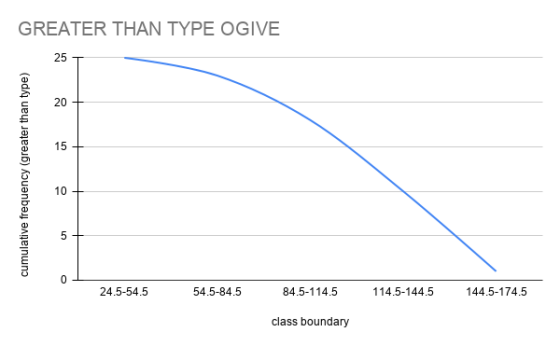
c) Plot its cumulative frequency (ogive).
d) Find the mode of the data.
e) Find the mean, , for the grouped data.
f) Find the variance and standard deviation for grouped data.
g) Find the z score and percentile for the value 98.
Homework Answers


 Though, in histogram and ogive,
the class boundaries in x axis should be laterally side by side, we
zoomed in and created gap intentionally for better understanding
purpose of the figure.
Though, in histogram and ogive,
the class boundaries in x axis should be laterally side by side, we
zoomed in and created gap intentionally for better understanding
purpose of the figure.

Add Answer to:
The number of annual precipitation days for one-half of the 50
largest U.S. cities is listed...
3) The number of annual precipitation days for one-half of the 50 largest U.S. cities is...
 3) The number of annual precipitation days for one-half of the 50 largest U.S. cities is listed below. Do the following: 131 94 136 88 116 123 88 102 112 98 55 90 116 27 125 77 80 127 79 156 47 117 97 55 133 a) Construct a frequency distribution for the data (include class boundaries in the table) with 5 classes. b) Graph its histogram. c) Plot its cumulative frequency (ogive). d) Find the mode of the data....
State the hypotheses and identify the claim, find the critical value(s), compute the test value, make...
State the hypotheses and identify the claim, find the critical value(s), compute the test value, make the decision, summarize the results (make the appropriate statement of the results of the claim included rejection or non-rejection of the null hypothesis). Please show all of your work. 3)The number of annual precipitation days for one-half of the 50 largest U.S. cities is listed below. Do the following: 131 94 136 88 116 77 127 79 47 97 116 123 88 102 27...
The data set represents the numbers of minutes a sample of 27 people distribution for the...
 The data set represents the numbers of minutes a sample of 27 people distribution for the data set using five classes. 1. exercise each week. Construct a frequency 108 139 120 123 120 132 123 131 131 157 150 124 111 101 135 119 116 117 127 128 139 119 118 114 127 142 130 Classes Class boundaries Frequency Midpoint Relative Cumulative frequeney frequency Relative Frequency Histogram Cumulative Frequency Graph or Ogive Relative Frequency Histogram Cumulative Frequency Graph or Ogive
How do I plot a series graph with this data provided? Month 1987 1988 1989 1990...
How do I plot a series graph with this data provided? Month 1987 1988 1989 1990 1991 1992 1993 1994 1995 1996 Jan 95 104 101 88 132 125 111 127 119 147 Feb 94 100 96 110 109 118 123 129 147 146 Mar 98 99 82 129 101 121 121 132 164 133 Apr 96 88 84 113 111 140 139 108 135 148 May 95 89 85 114 140 141 119 115 124 141 Jun 115 108...
1. The data are from the U.S. Department of Health and Human Services, National Center of...
 1. The data are from the U.S. Department of Health and Human Services, National Center of Health Statistics, Third National Health and Nutrition Examination Survey. The systolic blood pressure (mmHg) for 80 patients was measured. The following data is separated by gender Females: 89 92 93 93 94 95 97 98 99 100 101 102 104 104 104 105 106 106 107 107 107 108 108 110 112 113 113 114 114 116 116 118 119 123 124 125 127...
ASAP HELP!! A test was given to 50 fourth grade students The scores for the students...
 ASAP HELP!!
A test was given to 50 fourth grade students The scores for the students are given below. 93 108 91 116 92 87 100 88 109 110 91 119 88 100 86 119 113 85 103 118 100 112 87 95 95 94 114 87 119 96 113 100 112 100 107 93 91 95 111 108 110 88 117 101 88 97 118 87 114 103 (a) Construct a grouped frequency distribution for the data. Use 85-89...
ASAP HELP!!
A test was given to 50 fourth grade students The scores for the students are given below. 93 108 91 116 92 87 100 88 109 110 91 119 88 100 86 119 113 85 103 118 100 112 87 95 95 94 114 87 119 96 113 100 112 100 107 93 91 95 111 108 110 88 117 101 88 97 118 87 114 103 (a) Construct a grouped frequency distribution for the data. Use 85-89...
In exercises 43 and 44, use the data set and the indicated number of classes to...
In exercises 43 and 44, use the data set and the indicated number of classes to construct (a) an expanded frequency distribution, (b) a frequency histogram, (c) a frequency polygon, (d) a relative frequency histogram, and (e) an ogive. 43. Pulse Rates Number of classes: 6 Data set: Pulse rates all students in a class 68 105 95 80 90 100 75 70 84 98 102 70 65 88 90 75 78 94 110 120 95 80 76 108 44....
can you help me with this question please? thanks (a) 12 'one rupee' coins are distributed...
 can you help me with this question please? thanks
(a) 12 'one rupee' coins are distributed at random among 5 beggars A, B, C, D and E. Find the probability that: (1) They get 4, 2, 0, 5 and 1 coins respectively. (ii) Each beggar gets at least two coins. (iii) None of them goes empty handed. (b) The following data represent the profit in thousands over the last 60 months, of an SME 108 106 103 114 91 122...
can you help me with this question please? thanks
(a) 12 'one rupee' coins are distributed at random among 5 beggars A, B, C, D and E. Find the probability that: (1) They get 4, 2, 0, 5 and 1 coins respectively. (ii) Each beggar gets at least two coins. (iii) None of them goes empty handed. (b) The following data represent the profit in thousands over the last 60 months, of an SME 108 106 103 114 91 122...
Your IT department provided you data on patients that received ER services, their GHHS, and their recovery time. Prepare a report to share with the owners of the facility that will help you make infor...
Your IT department provided you data on patients that received ER services, their GHHS, and their recovery time. Prepare a report to share with the owners of the facility that will help you make informed decisions about how long you can expect a patients’ recovery time would be based on their GHHS. Based on your findings provide recommendations on your plan moving forward to improve the functioning of your facilities in generating revenue. Prepare a report that addresses each of...
You have two groups of apples (data below). You want to see if there is a...
You have two groups of apples (data below). You want to see if there is a statistical differnce between the two groups. Run descriptives and a two tailed, two sample assuming equal variance t-test. Here's your data: Weight of Apples in Grams Apple ID Farm A Farm B 1 131 151 2 147 159 3 134 162 4 134 158 5 136 159 6 137 160 7 140 150 8 134 160 9 136 160 10 133 160 11 134...
 3) The number of annual precipitation days for one-half of the 50 largest U.S. cities is listed below. Do the following: 131 94 136 88 116 123 88 102 112 98 55 90 116 27 125 77 80 127 79 156 47 117 97 55 133 a) Construct a frequency distribution for the data (include class boundaries in the table) with 5 classes. b) Graph its histogram. c) Plot its cumulative frequency (ogive). d) Find the mode of the data....
 The data set represents the numbers of minutes a sample of 27 people distribution for the data set using five classes. 1. exercise each week. Construct a frequency 108 139 120 123 120 132 123 131 131 157 150 124 111 101 135 119 116 117 127 128 139 119 118 114 127 142 130 Classes Class boundaries Frequency Midpoint Relative Cumulative frequeney frequency Relative Frequency Histogram Cumulative Frequency Graph or Ogive Relative Frequency Histogram Cumulative Frequency Graph or Ogive
 1. The data are from the U.S. Department of Health and Human Services, National Center of Health Statistics, Third National Health and Nutrition Examination Survey. The systolic blood pressure (mmHg) for 80 patients was measured. The following data is separated by gender Females: 89 92 93 93 94 95 97 98 99 100 101 102 104 104 104 105 106 106 107 107 107 108 108 110 112 113 113 114 114 116 116 118 119 123 124 125 127...
 ASAP HELP!!
A test was given to 50 fourth grade students The scores for the students are given below. 93 108 91 116 92 87 100 88 109 110 91 119 88 100 86 119 113 85 103 118 100 112 87 95 95 94 114 87 119 96 113 100 112 100 107 93 91 95 111 108 110 88 117 101 88 97 118 87 114 103 (a) Construct a grouped frequency distribution for the data. Use 85-89...
ASAP HELP!!
A test was given to 50 fourth grade students The scores for the students are given below. 93 108 91 116 92 87 100 88 109 110 91 119 88 100 86 119 113 85 103 118 100 112 87 95 95 94 114 87 119 96 113 100 112 100 107 93 91 95 111 108 110 88 117 101 88 97 118 87 114 103 (a) Construct a grouped frequency distribution for the data. Use 85-89...
 can you help me with this question please? thanks
(a) 12 'one rupee' coins are distributed at random among 5 beggars A, B, C, D and E. Find the probability that: (1) They get 4, 2, 0, 5 and 1 coins respectively. (ii) Each beggar gets at least two coins. (iii) None of them goes empty handed. (b) The following data represent the profit in thousands over the last 60 months, of an SME 108 106 103 114 91 122...
can you help me with this question please? thanks
(a) 12 'one rupee' coins are distributed at random among 5 beggars A, B, C, D and E. Find the probability that: (1) They get 4, 2, 0, 5 and 1 coins respectively. (ii) Each beggar gets at least two coins. (iii) None of them goes empty handed. (b) The following data represent the profit in thousands over the last 60 months, of an SME 108 106 103 114 91 122...
Most questions answered within 3 hours.
-
Problem: Patient Fees C++
You are to write a program that computes a patient’s bill for...
asked 24 minutes ago -
In a population of interest, we know that, 77% drink coffee, and
23% drink tea. Assume...
asked 51 minutes ago -
Given that f(x) = e-(x-1) for x > 1, determine the following
probabilities:
a) P(X <...
asked 35 minutes ago -
A mechanic pushes a 2.60 ✕ 103-kg car from rest to a speed of v,
doing...
asked 37 minutes ago -
International information systems result in all of the following
except:
A. improved quality of information flow....
asked 31 minutes ago -
The president of the retailer Prime Products has just approached
the company’s bank with a request...
asked 38 minutes ago -
If the carrying amount is $200,000 and recoverable amount is
$205000, the impairment amount is:
Select...
asked 42 minutes ago -
The correlation is inappropriate as a measure of association
between two quantitative variables (you may select...
asked 47 minutes ago -
USE THE DATA IN THE TABLE BELOW TO ANSWER QUESTIONS 19 – 24
(Assume all account...
asked 50 minutes ago -
Mahaley, Inc., manufactures and sells two products: Product Q9
and Product F0. Data concerning the expected...
asked 1 hour ago -
To measure the current through one branch of a parallel circuit,
the meter is connected ________....
asked 1 hour ago -
a)
The following table shows the profile, by the math section of
the SAT Reasoning Test,...
asked 1 hour ago