
Homework Answers
1. A monopolistic firm produces at the point where MR= MC. The corresponding price charged is P1 while the corresponding cost is C1. Since the ATC curve lies above the price charged, the firm is incurring losses. The operating loss is presented by the black rectangle.
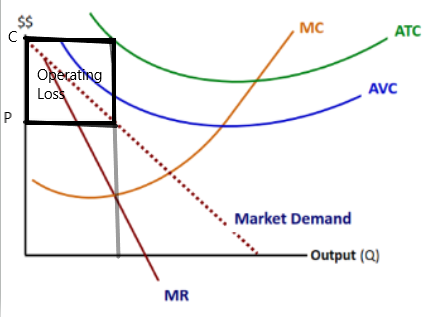
2. The firm should not continue production/ operation. This is so because at the equilibrium quantity, the firm is not even able to cover its variable cost (the AVC curve lies above price). This implies the firm should shut down.
Add Answer to:
II.E. Draw and label the rectangle that represents the "Operating Profit or Loss" generated by this...
II.A. Identify and label the profit-maximizing level of output (Q) that will be pursued by this...
 II.A. Identify and label the profit-maximizing level of output (Q) that will be pursued by this 'monopolistic' firm. (5 Points) $$ MC ATC AVC Market Demand Output(Q) MR II.B. Draw and label the rectangle that represents the Total Revenue (TR) generated by this 'monopolistic' firm. (5 Points) $$ MC ATC AVC Market Demand -Output(Q) MR II.C. Draw and label the rectangles that represent Total Cost (TC), Total Fixed Cost (TFC) and Total Variable Cost (TVC) generated by this ‘monopolistic' firm....
Graph Worksheet MC DI MR P4 ATC P3 P2 AVC PI 02 1. What is the...
 Graph Worksheet MC DI MR P4 ATC P3 P2 AVC PI 02 1. What is the price and quantity at the optimum level of production? Is this an economic profit, loss, or break-even? Should the firm produce? 2. If the industry model is monopolistic competition, what will happen to the industry? What will happen to the demand and marginal revenue curves for the individual firm? In the long run where will the demand curve be? Will the firm achieve productive...
Consider a competitive rm with total costs given by TC(q) = 100 + 10q + q^2,...
Consider a competitive rm with total costs given by TC(q) = 100 + 10q + q^2, The firm faces a market price p = 50. (a) Write expressions for total revenue TR and marginal revenue MR as functions of output q. (b) Write expressions for average total cost ATC, average variable cost AVC, and marginal cost MC as functions of output q. (c) For what value of output is ATC minimized? (d) Find the profit maximizing level of output q...
Price/Cost ($) 7) Monopoly II (6 points) The marginal costs (MC), average variable costs (AVC), and...
 Price/Cost ($) 7) Monopoly II (6 points) The marginal costs (MC), average variable costs (AVC), and average total costs (ATC) for a monopoly are shown in the figure below. The figure also shows the demand curve (D) and the marginal revenue curve (MR) for this market. 501 ATC AVC a. What is the firm's profit-maximizing level of output? Label this on the graph. b. What price will the monopolist charge for that level of output? Label this on the graph....
Perfect Competition Competition Monopolistic Monopoly Oligopoly Goal of firmsMaximize Profit Rule...
 how would you fill out this graph?
Perfect Competition Competition Monopolistic Monopoly Oligopoly Goal of firmsMaximize Profit Rule for maximizing profit MR-MC Can earn economic profits in the short run? Yes Can earn economic profits in the long run? Yes Price taker? Sometimes P2MC Sometimes Price & MC Produces welfare maximizing output? Number of firms? Few 3. (1 point) Consider a world where only blank t-shirts are produced. Draw hypothetical Demand faced by a firm, MR, MC, and ATC curves...
how would you fill out this graph?
Perfect Competition Competition Monopolistic Monopoly Oligopoly Goal of firmsMaximize Profit Rule for maximizing profit MR-MC Can earn economic profits in the short run? Yes Can earn economic profits in the long run? Yes Price taker? Sometimes P2MC Sometimes Price & MC Produces welfare maximizing output? Number of firms? Few 3. (1 point) Consider a world where only blank t-shirts are produced. Draw hypothetical Demand faced by a firm, MR, MC, and ATC curves...
Help with 14-16 please. 14. A Monopoly: A. Will realize an economic profit if price exceeds...
 Help with 14-16 please.
14. A Monopoly: A. Will realize an economic profit if price exceeds ATC at the profit-maximizing/loss-minimizing level of output. B. Will realize an economic profit if ATC exceeds MR at the profit-maximizing/loss-minimizing level of output c. Will realize an economic loss if MC intersects the down-sloping portion of MR D. Always realizes an economic profit. MC ATC AVC 15. At equilibrium, the profit-maximizing monopolist facing the situation shown in the graph above will face: A. Average...
Help with 14-16 please.
14. A Monopoly: A. Will realize an economic profit if price exceeds ATC at the profit-maximizing/loss-minimizing level of output. B. Will realize an economic profit if ATC exceeds MR at the profit-maximizing/loss-minimizing level of output c. Will realize an economic loss if MC intersects the down-sloping portion of MR D. Always realizes an economic profit. MC ATC AVC 15. At equilibrium, the profit-maximizing monopolist facing the situation shown in the graph above will face: A. Average...
1. Draw two graphs. On the first, show the short-run profit maximizing output of an individual...
1. Draw two graphs. On the first, show the short-run profit maximizing output of an individual firm earning an economic profit, including MR, MC, AVC, and ATC. On the second, show the short-run market equilibrium price and quantity. Explain how the industry supply curve and the market equilibrium price and quantity are determined. 2. What is the relationship between the price on the two graphs? Why does this relationship exist? 3. Explain why a firm in a perfectly competitive industry...
The market price is p=50 3. Consider a competitive firm with total costs given by TC(q)...
 The market price is p=50
3. Consider a competitive firm with total costs given by TC(q) = 100 + 10q+q? (e) Graph the ATC, AVC, MC, and MR curves in a single graph, and indicate the profit maximizing level of output. If there are profits, shade the region corre- sponding to profit and label it. (f) If fixed costs increase from 100 to 500, what happens to the profit maximizing level of output, TR, TC, and a? (g) If fixed...
The market price is p=50
3. Consider a competitive firm with total costs given by TC(q) = 100 + 10q+q? (e) Graph the ATC, AVC, MC, and MR curves in a single graph, and indicate the profit maximizing level of output. If there are profits, shade the region corre- sponding to profit and label it. (f) If fixed costs increase from 100 to 500, what happens to the profit maximizing level of output, TR, TC, and a? (g) If fixed...
Price MC ATC AVC - MR 40 45 47 Quantity a. (1 points) Using the graph...
 Price MC ATC AVC - MR 40 45 47 Quantity a. (1 points) Using the graph above, what is the profit maximizing or loss minimizing output and price? b. (1 point)Using the graph above, what is the profit or loss for the profit maximizing firm? c. (2 points) What would happen in this market in the long run. Be sure to explain in detail what happens in the market and the firm. What would be the long run price, and...
(a) Find the total profit or total loss of the firm shown in Figure 8. (b)...
 (a) Find the total profit or total loss of the firm
shown in Figure 8.
(b) Is the firm not he short run or the long run?
(c) How much is the firm's most efficient output?
(d) What is the lowest price the firm would accept in the long
run?
MC 14 12 2 10 ATC D, MR 4 8 12 16 20 24 Output Figure 8
(a) Find the total profit or total loss of the firm
shown in Figure 8.
(b) Is the firm not he short run or the long run?
(c) How much is the firm's most efficient output?
(d) What is the lowest price the firm would accept in the long
run?
MC 14 12 2 10 ATC D, MR 4 8 12 16 20 24 Output Figure 8
 II.A. Identify and label the profit-maximizing level of output (Q) that will be pursued by this 'monopolistic' firm. (5 Points) $$ MC ATC AVC Market Demand Output(Q) MR II.B. Draw and label the rectangle that represents the Total Revenue (TR) generated by this 'monopolistic' firm. (5 Points) $$ MC ATC AVC Market Demand -Output(Q) MR II.C. Draw and label the rectangles that represent Total Cost (TC), Total Fixed Cost (TFC) and Total Variable Cost (TVC) generated by this ‘monopolistic' firm....
 Graph Worksheet MC DI MR P4 ATC P3 P2 AVC PI 02 1. What is the price and quantity at the optimum level of production? Is this an economic profit, loss, or break-even? Should the firm produce? 2. If the industry model is monopolistic competition, what will happen to the industry? What will happen to the demand and marginal revenue curves for the individual firm? In the long run where will the demand curve be? Will the firm achieve productive...
 Price/Cost ($) 7) Monopoly II (6 points) The marginal costs (MC), average variable costs (AVC), and average total costs (ATC) for a monopoly are shown in the figure below. The figure also shows the demand curve (D) and the marginal revenue curve (MR) for this market. 501 ATC AVC a. What is the firm's profit-maximizing level of output? Label this on the graph. b. What price will the monopolist charge for that level of output? Label this on the graph....
 how would you fill out this graph?
Perfect Competition Competition Monopolistic Monopoly Oligopoly Goal of firmsMaximize Profit Rule for maximizing profit MR-MC Can earn economic profits in the short run? Yes Can earn economic profits in the long run? Yes Price taker? Sometimes P2MC Sometimes Price & MC Produces welfare maximizing output? Number of firms? Few 3. (1 point) Consider a world where only blank t-shirts are produced. Draw hypothetical Demand faced by a firm, MR, MC, and ATC curves...
how would you fill out this graph?
Perfect Competition Competition Monopolistic Monopoly Oligopoly Goal of firmsMaximize Profit Rule for maximizing profit MR-MC Can earn economic profits in the short run? Yes Can earn economic profits in the long run? Yes Price taker? Sometimes P2MC Sometimes Price & MC Produces welfare maximizing output? Number of firms? Few 3. (1 point) Consider a world where only blank t-shirts are produced. Draw hypothetical Demand faced by a firm, MR, MC, and ATC curves...
 Help with 14-16 please.
14. A Monopoly: A. Will realize an economic profit if price exceeds ATC at the profit-maximizing/loss-minimizing level of output. B. Will realize an economic profit if ATC exceeds MR at the profit-maximizing/loss-minimizing level of output c. Will realize an economic loss if MC intersects the down-sloping portion of MR D. Always realizes an economic profit. MC ATC AVC 15. At equilibrium, the profit-maximizing monopolist facing the situation shown in the graph above will face: A. Average...
Help with 14-16 please.
14. A Monopoly: A. Will realize an economic profit if price exceeds ATC at the profit-maximizing/loss-minimizing level of output. B. Will realize an economic profit if ATC exceeds MR at the profit-maximizing/loss-minimizing level of output c. Will realize an economic loss if MC intersects the down-sloping portion of MR D. Always realizes an economic profit. MC ATC AVC 15. At equilibrium, the profit-maximizing monopolist facing the situation shown in the graph above will face: A. Average...
 The market price is p=50
3. Consider a competitive firm with total costs given by TC(q) = 100 + 10q+q? (e) Graph the ATC, AVC, MC, and MR curves in a single graph, and indicate the profit maximizing level of output. If there are profits, shade the region corre- sponding to profit and label it. (f) If fixed costs increase from 100 to 500, what happens to the profit maximizing level of output, TR, TC, and a? (g) If fixed...
The market price is p=50
3. Consider a competitive firm with total costs given by TC(q) = 100 + 10q+q? (e) Graph the ATC, AVC, MC, and MR curves in a single graph, and indicate the profit maximizing level of output. If there are profits, shade the region corre- sponding to profit and label it. (f) If fixed costs increase from 100 to 500, what happens to the profit maximizing level of output, TR, TC, and a? (g) If fixed...
 Price MC ATC AVC - MR 40 45 47 Quantity a. (1 points) Using the graph above, what is the profit maximizing or loss minimizing output and price? b. (1 point)Using the graph above, what is the profit or loss for the profit maximizing firm? c. (2 points) What would happen in this market in the long run. Be sure to explain in detail what happens in the market and the firm. What would be the long run price, and...
 (a) Find the total profit or total loss of the firm
shown in Figure 8.
(b) Is the firm not he short run or the long run?
(c) How much is the firm's most efficient output?
(d) What is the lowest price the firm would accept in the long
run?
MC 14 12 2 10 ATC D, MR 4 8 12 16 20 24 Output Figure 8
(a) Find the total profit or total loss of the firm
shown in Figure 8.
(b) Is the firm not he short run or the long run?
(c) How much is the firm's most efficient output?
(d) What is the lowest price the firm would accept in the long
run?
MC 14 12 2 10 ATC D, MR 4 8 12 16 20 24 Output Figure 8
Most questions answered within 3 hours.
-
Write a program to solve the Josephus problem, with the following
modification:
Sample Input:
./a.out n...
asked 2 hours ago -
At the start of a CD it is spinning at a rate of 525 rpm
(revolutions...
asked 2 hours ago -
4. Without doing any calculations, predict whether the observed
∆T would increase, decrease or remain the...
asked 4 hours ago -
Based on the range, which of the following sets of scores has
the greatest variability? 3,...
asked 5 hours ago -
Ripples in a pond travel at a velocity of 3 m/s with one peak
passing a...
asked 5 hours ago -
A man stands on the roof of a building of height 13.0 mm and
throws a...
asked 5 hours ago -
The extent to which assets are financed by borrowed funds and
other liabilities is indicated by:...
asked 6 hours ago -
Explain in detail
Germany is the fifth largest economy
explain what goods and services Germany specializes...
asked 6 hours ago -
The density of platinum is 21.45 g/mL. If a cube of platinum
with a mass of...
asked 6 hours ago -
Accounts Receivable
Sales
A/R Posting
Extended Sales Invoice
Packing Slip
Compare invoice to packing slip 2...
asked 6 hours ago -
Michaella, age 23, is a full-time law student and is claimed by
her parents as a...
asked 6 hours ago -
Why are polymers not typically casted into products?
asked 6 hours ago