


Homework Answers
Solution :
4(a) The null and alternative hypotheses would be as follows :


4(b) To test the hypothesis the most appropriate test is chi-square test for single variance. The test statistic is given as follows :
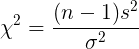
Where, s is sample standard deviation, n is sample size and σ is hypothesized value of population standard deviation under H0.
We have, s = 0.5, n = 10 and σ = 1.8
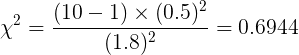
The value of the test statistic is 0.6944.
c) The p-value for the test is 0.0001.
Significance level = 0.05
(0.0001 < 0.05)
Since, p-value is less than the significance level of 0.05, therefore we shall reject the null hypothesis at 0.05 significance level.
d) At 0.05 significance level, there is sufficient evidence to support the claim that sample is from a population with a standard deviation less than 1.8.
e) The conclusion suggest that the single waiting line is effective in reducing the variability of waiting times.
Add Answer to:
Please answer questions 4 and 6 with steps.
Sample data from Exercise 1 used for question...
Please answer question 6. Data set for problem : Testing Claims About Variation. In Exercises 5-16,...
 Please answer question 6.
Data set for problem :
Testing Claims About Variation. In Exercises 5-16, test the given claim. Identify the null hypothesis, alternative hypothesis, test statistic, P-value or critical value(s), conclusion about the null hypothesis, and final conclusion that addresses the original claim. Assume that a simple random sample is selected from a normally distributed population. 5. Cans of Coke Data Set 19 in Appendix B includes volumes (oz) of a simple random sample of 36 cans of...
Please answer question 6.
Data set for problem :
Testing Claims About Variation. In Exercises 5-16, test the given claim. Identify the null hypothesis, alternative hypothesis, test statistic, P-value or critical value(s), conclusion about the null hypothesis, and final conclusion that addresses the original claim. Assume that a simple random sample is selected from a normally distributed population. 5. Cans of Coke Data Set 19 in Appendix B includes volumes (oz) of a simple random sample of 36 cans of...
PSI PEPSI DIET DIET WT VOL 0.7925 0,7868 0.7846 22 0,7938 0.7861 0,7844 0.7795 0,7883 0,7879...
 PSI PEPSI DIET DIET WT VOL 0.7925 0,7868 0.7846 22 0,7938 0.7861 0,7844 0.7795 0,7883 0,7879 0.7850 2.3 0.7899 0,7877 0.7852 0.7756 2.1 0.783712.2 0.7879 0.7839 2.2 0.7817 0,7822 0.7742 0.7833 0.7835 0.7855 0.7859 2.2 0.7775 0.7833 0.7835 0.7826 122 0.7815 0.7791 0.7866123 0.7855 12.2 0.7848 0.7806 0.7773 0.7775 COKE DIETPEPSI REGPEPSI REG PE COKE COKE REG COKE REG WT VOL 0.8192 23 0.8150 12.1 0.8163 12.2 08211 VOL NT 0.8258 124 0.8156 12.2 08211 0,8170 DIET WT VOL 0.7758...
Via Excel please 11. Weights of Coke. Construct a frequency table for the weights (in pounds)...
 Via Excel please
11. Weights of Coke. Construct a frequency table for the weights (in pounds) given below of 36 cans of regular Coke. Start the first bin at 0.7900 pound and use a bin width of 0.0050 pound. Discuss your findings. 0.8192 0.8194 0.8211 0,8176 0.8062 0.81430.8110 0.8152 0.7901 0.8152 0.8079 0.8161 0.8161 0.8163 0.8194 0.8247 0.8165 0.8172 0.8150 0.8264 0.8207 0.8073 0.8295 0.8170 0.8150 0.81890.8181 0.8284 0.8128 0.8229 0.8251 0.8244 0.8244 0.8126 0.8044 0.8192 12. Weights of Diet...
Via Excel please
11. Weights of Coke. Construct a frequency table for the weights (in pounds) given below of 36 cans of regular Coke. Start the first bin at 0.7900 pound and use a bin width of 0.0050 pound. Discuss your findings. 0.8192 0.8194 0.8211 0,8176 0.8062 0.81430.8110 0.8152 0.7901 0.8152 0.8079 0.8161 0.8161 0.8163 0.8194 0.8247 0.8165 0.8172 0.8150 0.8264 0.8207 0.8073 0.8295 0.8170 0.8150 0.81890.8181 0.8284 0.8128 0.8229 0.8251 0.8244 0.8244 0.8126 0.8044 0.8192 12. Weights of Diet...
Weights of Diet coke. Construct a frequency table for the weights (in pounds) given below of...
Weights of Diet coke. Construct a frequency table for the weights (in pounds) given below of 36 cans of Diet Coke. Start the first bin at 0.775 pound and use a bin width of 0.0050 pound. 0.775 0.7758 0.776 0.7771 0.7773 0.7802 0.7806 0.7811 0.7813 0.7822 0.7822 0.7822 0.7826 0.783 0.7833 0.7839 0.7844 0.7852 0.7852 0.7852 0.7859 0.7861 0.7868 0.787 0.7872 0.7874 0.7874 0.7879 0.7879 0.7881 0.7885 0.7892 0.7896 0.7907 0.791 0.7923 0.7923
 Please answer question 6.
Data set for problem :
Testing Claims About Variation. In Exercises 5-16, test the given claim. Identify the null hypothesis, alternative hypothesis, test statistic, P-value or critical value(s), conclusion about the null hypothesis, and final conclusion that addresses the original claim. Assume that a simple random sample is selected from a normally distributed population. 5. Cans of Coke Data Set 19 in Appendix B includes volumes (oz) of a simple random sample of 36 cans of...
Please answer question 6.
Data set for problem :
Testing Claims About Variation. In Exercises 5-16, test the given claim. Identify the null hypothesis, alternative hypothesis, test statistic, P-value or critical value(s), conclusion about the null hypothesis, and final conclusion that addresses the original claim. Assume that a simple random sample is selected from a normally distributed population. 5. Cans of Coke Data Set 19 in Appendix B includes volumes (oz) of a simple random sample of 36 cans of...
 PSI PEPSI DIET DIET WT VOL 0.7925 0,7868 0.7846 22 0,7938 0.7861 0,7844 0.7795 0,7883 0,7879 0.7850 2.3 0.7899 0,7877 0.7852 0.7756 2.1 0.783712.2 0.7879 0.7839 2.2 0.7817 0,7822 0.7742 0.7833 0.7835 0.7855 0.7859 2.2 0.7775 0.7833 0.7835 0.7826 122 0.7815 0.7791 0.7866123 0.7855 12.2 0.7848 0.7806 0.7773 0.7775 COKE DIETPEPSI REGPEPSI REG PE COKE COKE REG COKE REG WT VOL 0.8192 23 0.8150 12.1 0.8163 12.2 08211 VOL NT 0.8258 124 0.8156 12.2 08211 0,8170 DIET WT VOL 0.7758...
 Via Excel please
11. Weights of Coke. Construct a frequency table for the weights (in pounds) given below of 36 cans of regular Coke. Start the first bin at 0.7900 pound and use a bin width of 0.0050 pound. Discuss your findings. 0.8192 0.8194 0.8211 0,8176 0.8062 0.81430.8110 0.8152 0.7901 0.8152 0.8079 0.8161 0.8161 0.8163 0.8194 0.8247 0.8165 0.8172 0.8150 0.8264 0.8207 0.8073 0.8295 0.8170 0.8150 0.81890.8181 0.8284 0.8128 0.8229 0.8251 0.8244 0.8244 0.8126 0.8044 0.8192 12. Weights of Diet...
Via Excel please
11. Weights of Coke. Construct a frequency table for the weights (in pounds) given below of 36 cans of regular Coke. Start the first bin at 0.7900 pound and use a bin width of 0.0050 pound. Discuss your findings. 0.8192 0.8194 0.8211 0,8176 0.8062 0.81430.8110 0.8152 0.7901 0.8152 0.8079 0.8161 0.8161 0.8163 0.8194 0.8247 0.8165 0.8172 0.8150 0.8264 0.8207 0.8073 0.8295 0.8170 0.8150 0.81890.8181 0.8284 0.8128 0.8229 0.8251 0.8244 0.8244 0.8126 0.8044 0.8192 12. Weights of Diet...
Most questions answered within 3 hours.
-
A company's total assets at the end of last year were 500,000
and its EBIT was...
asked 1 minute ago -
Is it redundant to say that a pure substance is homogeneous, or
can it not be...
asked 4 minutes ago -
Already famous by the time he arrived at Princeton University in
1933, Einstein had suggested a...
asked 23 minutes ago -
Suppose the average male brain weight (in grams) is estimated to
be 13201320 grams. A 1905...
asked 32 minutes ago -
For each molecular substance (a) H3PO2 and (b) C6H5NH2,
calculate its molecular mass and write a...
asked 25 minutes ago -
The inheritance of color blindness in humans is due to a
recessive gene located on the...
asked 28 minutes ago -
Aqueous sulfuric acid (H2SO4) reacts with solid sodium hydroxide
(NaOH) to produce aqueous sodium sulfate (Na2SO4)...
asked 29 minutes ago -
QUESTION 25:
Find the pure binary representation of the following decimal
value: You DO NOT need...
asked 33 minutes ago -
The English mathematician John Kerrich tossed a coin
10,000 times and obtained 5067 heads.
a. calculate...
asked 59 minutes ago -
13. Use the Student's t-distribution to find the t-value for
each of the given scenarios. Round...
asked 52 minutes ago -
Explain the nutrition assessment for the lower gastrointestinal
tract, including the components of client history, anthropometric...
asked 52 minutes ago -
1.Marc has tried to quit heroin seven times only to
relapse each and every time. Marc...
asked 1 hour ago