
Homework Answers
Add Answer to:
The diagram shown below represents the mass spectrum (MS data) for which of the following compounds?...
zene, C6H6? 12-23 Propose structures for compounds that fit the following data: al A ketone with M+ 86 and fragments...
 zene, C6H6? 12-23 Propose structures for compounds that fit the following data: al A ketone with M+ 86 and fragments at m/z 71 and m/z 43 h An alcohol with M+ = 88 and fragments at m/z 73, m/z 70, and m/z = 59 12-24 2-Methylpentane (C6H14) has the mass spectrum shown. Which peak represents M+? Which is the base peak? Propose structures for frag- ment ions of m/z 71, 57, 43, and 29. Why does the base peak have...
please answer for 10.5 this is all information provided. Identify the following compounds from their mass spectra an...
 please answer for 10.5
this is all information provided.
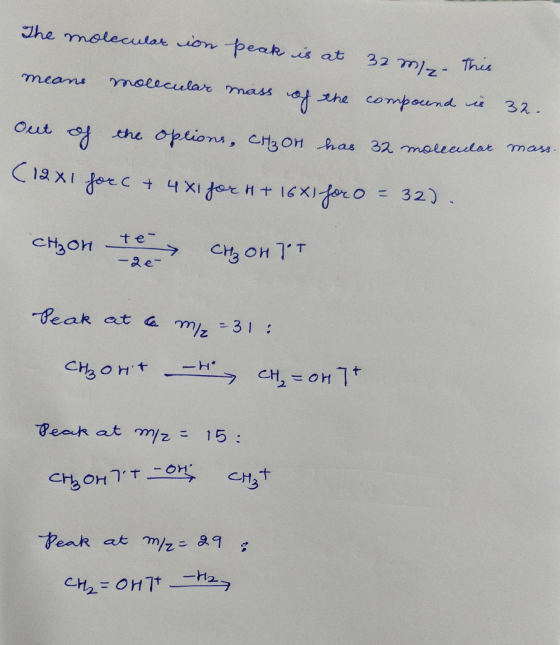
Identify the following compounds from their mass spectra and the data provided: 10.4 m/z Relative abundance 28 6.3 29 64 30 3.8 31 100 32 66 33 0.98 34 0.14 10.5 m/z Relative abundance 14 17 15 100 16 10 19 2.0 31 10 32 9.3 33 89 34 95 35 1.1 31 les 0 12/11 10 20 30 40 50 60 70 80 90 100 110
please answer for 10.5
this is all information provided.
Identify the following compounds from their mass spectra and the data provided: 10.4 m/z Relative abundance 28 6.3 29 64 30 3.8 31 100 32 66 33 0.98 34 0.14 10.5 m/z Relative abundance 14 17 15 100 16 10 19 2.0 31 10 32 9.3 33 89 34 95 35 1.1 31 les 0 12/11 10 20 30 40 50 60 70 80 90 100 110
The diagram shows the mass spectrum of an organic compound 00 Relative abundance 20 40 60...
 The diagram shows the mass spectrum of an organic compound 00 Relative abundance 20 40 60 80 100 m/z Which compound was analysed? Periodic Table of the Elements
C. D. Iron(II) carbonate Lead(II) carbonate 4 The diagram shows the mass spectrum of an organic...
 C. D. Iron(II) carbonate Lead(II) carbonate 4 The diagram shows the mass spectrum of an organic compound. 60 100 Relative abundance 73 27 41 88 0+ 0 20 40 60 80 100 m/z Which compound was analysed?
identify the following compounds from their mass spectra and the data provided. only 10.5 and 10.9...
 identify the following compounds from their mass spectra and
the data provided.
only 10.5 and 10.9
10:53 AM Tue Nov 19 100% Undergraduate Instrumental Analysis (PDFDrive.com) Done Identify the following compounds from their mass spectra and the data provided: 10.4 m/z 28 29 30 31 32 33 34 0.98 Relative abundance 6.3 64 3.8 100 66 0.14 10.5 m/z 14 15 19 31 32 34 35 Relative abundance 17 100 1.0 2.0 10 9.3 89 95 1.1 34 100 33...
identify the following compounds from their mass spectra and
the data provided.
only 10.5 and 10.9
10:53 AM Tue Nov 19 100% Undergraduate Instrumental Analysis (PDFDrive.com) Done Identify the following compounds from their mass spectra and the data provided: 10.4 m/z 28 29 30 31 32 33 34 0.98 Relative abundance 6.3 64 3.8 100 66 0.14 10.5 m/z 14 15 19 31 32 34 35 Relative abundance 17 100 1.0 2.0 10 9.3 89 95 1.1 34 100 33...
sro Refer to the mass spectrum of 2-methylbutae shown below to za tebe 100- 80 60...
 sro Refer to the mass spectrum of 2-methylbutae shown below to za tebe 100- 80 60 Relative htensity 40 20 72 0 10 20 30 40 50 80 90 100 110 12 80 70 m/z The peak at a mz of represents the following species. -CH.CH
Use the mass spectrum and either the NMR spectrum or the IR spectrum to deduce the...
 Use the mass spectrum and either the NMR spectrum or the IR
spectrum to deduce the structure of the following compound
(c) C8HO3H NMR, 300 MHz, 6.1 ppm (singlet, 2H), 6.9 ppm (doublet, 1H), and 7.3 ppm (singlet, 1H), 7.4 ppm (doublet, 1H), 9.8 ppm (singlet, 1H); significant IR absorbances at 1687, 1602, 1449, 1264, 1038, 929, and 815 cm1. 100 149 (150) 80 60 40 121 63 20 65 91 0 15 20 25 30 35 40 45 50...
Use the mass spectrum and either the NMR spectrum or the IR
spectrum to deduce the structure of the following compound
(c) C8HO3H NMR, 300 MHz, 6.1 ppm (singlet, 2H), 6.9 ppm (doublet, 1H), and 7.3 ppm (singlet, 1H), 7.4 ppm (doublet, 1H), 9.8 ppm (singlet, 1H); significant IR absorbances at 1687, 1602, 1449, 1264, 1038, 929, and 815 cm1. 100 149 (150) 80 60 40 121 63 20 65 91 0 15 20 25 30 35 40 45 50...
Use the IR and MS data to elucidate the structures of the compounds below. Identify the...
 Use the IR and MS data to elucidate the structures of the compounds below. Identify the M and other necessary peaks in the mass spectra below. Give the functional group responsible for the IR signals. IR: (1 709) sharp, strong (1607-1653) weak MS: ID 4 peaks 100- Relative Intensity orta pripreme 10 20 30 40 50 60 70 80 90 100 m/z 110 120 IR: (1753) strong (1602 - 1658) weak MS: ID 4 peaks 100 MS-NU-18 Relative Intensity 10...
110 2. (1 points) The mass spectrum of 2-methyl-3-pentanol is shown below. Identify the fragments. 100- MS-NU-5456...
 110 2. (1 points) The mass spectrum of 2-methyl-3-pentanol is shown below. Identify the fragments. 100- MS-NU-5456 Relative Intensity 0- t THAT it 20 TH 40 E 60 TITTTTTTTT 100 50 70 m/z
4. Based on the mass spectrum below - which heteroatom (S, Br, or CI) is present in the molecule that produces this spectrum? 100 91 172 Relative abundance 80 M 100 M+1 13 M+2 97 60 40 65 20 0 80 100...
 4. Based on the mass spectrum below - which heteroatom (S, Br, or CI) is present in the molecule that produces this spectrum? 100 91 172 Relative abundance 80 M 100 M+1 13 M+2 97 60 40 65 20 0 80 100 120 140160180200 20 40 60 miz
4. Based on the mass spectrum below - which heteroatom (S, Br, or CI) is present in the molecule that produces this spectrum? 100 91 172 Relative abundance 80 M 100 M+1...
4. Based on the mass spectrum below - which heteroatom (S, Br, or CI) is present in the molecule that produces this spectrum? 100 91 172 Relative abundance 80 M 100 M+1 13 M+2 97 60 40 65 20 0 80 100 120 140160180200 20 40 60 miz
4. Based on the mass spectrum below - which heteroatom (S, Br, or CI) is present in the molecule that produces this spectrum? 100 91 172 Relative abundance 80 M 100 M+1...
 zene, C6H6? 12-23 Propose structures for compounds that fit the following data: al A ketone with M+ 86 and fragments at m/z 71 and m/z 43 h An alcohol with M+ = 88 and fragments at m/z 73, m/z 70, and m/z = 59 12-24 2-Methylpentane (C6H14) has the mass spectrum shown. Which peak represents M+? Which is the base peak? Propose structures for frag- ment ions of m/z 71, 57, 43, and 29. Why does the base peak have...
 please answer for 10.5
this is all information provided.
Identify the following compounds from their mass spectra and the data provided: 10.4 m/z Relative abundance 28 6.3 29 64 30 3.8 31 100 32 66 33 0.98 34 0.14 10.5 m/z Relative abundance 14 17 15 100 16 10 19 2.0 31 10 32 9.3 33 89 34 95 35 1.1 31 les 0 12/11 10 20 30 40 50 60 70 80 90 100 110
please answer for 10.5
this is all information provided.
Identify the following compounds from their mass spectra and the data provided: 10.4 m/z Relative abundance 28 6.3 29 64 30 3.8 31 100 32 66 33 0.98 34 0.14 10.5 m/z Relative abundance 14 17 15 100 16 10 19 2.0 31 10 32 9.3 33 89 34 95 35 1.1 31 les 0 12/11 10 20 30 40 50 60 70 80 90 100 110
 The diagram shows the mass spectrum of an organic compound 00 Relative abundance 20 40 60 80 100 m/z Which compound was analysed? Periodic Table of the Elements
 C. D. Iron(II) carbonate Lead(II) carbonate 4 The diagram shows the mass spectrum of an organic compound. 60 100 Relative abundance 73 27 41 88 0+ 0 20 40 60 80 100 m/z Which compound was analysed?
 identify the following compounds from their mass spectra and
the data provided.
only 10.5 and 10.9
10:53 AM Tue Nov 19 100% Undergraduate Instrumental Analysis (PDFDrive.com) Done Identify the following compounds from their mass spectra and the data provided: 10.4 m/z 28 29 30 31 32 33 34 0.98 Relative abundance 6.3 64 3.8 100 66 0.14 10.5 m/z 14 15 19 31 32 34 35 Relative abundance 17 100 1.0 2.0 10 9.3 89 95 1.1 34 100 33...
identify the following compounds from their mass spectra and
the data provided.
only 10.5 and 10.9
10:53 AM Tue Nov 19 100% Undergraduate Instrumental Analysis (PDFDrive.com) Done Identify the following compounds from their mass spectra and the data provided: 10.4 m/z 28 29 30 31 32 33 34 0.98 Relative abundance 6.3 64 3.8 100 66 0.14 10.5 m/z 14 15 19 31 32 34 35 Relative abundance 17 100 1.0 2.0 10 9.3 89 95 1.1 34 100 33...
 sro Refer to the mass spectrum of 2-methylbutae shown below to za tebe 100- 80 60 Relative htensity 40 20 72 0 10 20 30 40 50 80 90 100 110 12 80 70 m/z The peak at a mz of represents the following species. -CH.CH
 Use the mass spectrum and either the NMR spectrum or the IR
spectrum to deduce the structure of the following compound
(c) C8HO3H NMR, 300 MHz, 6.1 ppm (singlet, 2H), 6.9 ppm (doublet, 1H), and 7.3 ppm (singlet, 1H), 7.4 ppm (doublet, 1H), 9.8 ppm (singlet, 1H); significant IR absorbances at 1687, 1602, 1449, 1264, 1038, 929, and 815 cm1. 100 149 (150) 80 60 40 121 63 20 65 91 0 15 20 25 30 35 40 45 50...
Use the mass spectrum and either the NMR spectrum or the IR
spectrum to deduce the structure of the following compound
(c) C8HO3H NMR, 300 MHz, 6.1 ppm (singlet, 2H), 6.9 ppm (doublet, 1H), and 7.3 ppm (singlet, 1H), 7.4 ppm (doublet, 1H), 9.8 ppm (singlet, 1H); significant IR absorbances at 1687, 1602, 1449, 1264, 1038, 929, and 815 cm1. 100 149 (150) 80 60 40 121 63 20 65 91 0 15 20 25 30 35 40 45 50...
 Use the IR and MS data to elucidate the structures of the compounds below. Identify the M and other necessary peaks in the mass spectra below. Give the functional group responsible for the IR signals. IR: (1 709) sharp, strong (1607-1653) weak MS: ID 4 peaks 100- Relative Intensity orta pripreme 10 20 30 40 50 60 70 80 90 100 m/z 110 120 IR: (1753) strong (1602 - 1658) weak MS: ID 4 peaks 100 MS-NU-18 Relative Intensity 10...
 110 2. (1 points) The mass spectrum of 2-methyl-3-pentanol is shown below. Identify the fragments. 100- MS-NU-5456 Relative Intensity 0- t THAT it 20 TH 40 E 60 TITTTTTTTT 100 50 70 m/z
 4. Based on the mass spectrum below - which heteroatom (S, Br, or CI) is present in the molecule that produces this spectrum? 100 91 172 Relative abundance 80 M 100 M+1 13 M+2 97 60 40 65 20 0 80 100 120 140160180200 20 40 60 miz
4. Based on the mass spectrum below - which heteroatom (S, Br, or CI) is present in the molecule that produces this spectrum? 100 91 172 Relative abundance 80 M 100 M+1...
4. Based on the mass spectrum below - which heteroatom (S, Br, or CI) is present in the molecule that produces this spectrum? 100 91 172 Relative abundance 80 M 100 M+1 13 M+2 97 60 40 65 20 0 80 100 120 140160180200 20 40 60 miz
4. Based on the mass spectrum below - which heteroatom (S, Br, or CI) is present in the molecule that produces this spectrum? 100 91 172 Relative abundance 80 M 100 M+1...
Most questions answered within 3 hours.
-
Calculate the molality, mole-fraction and percent mass of 28.9M
HF at 25 degrees Celcius of the...
asked 4 minutes ago -
A developmental psychologist believes that children raised in
bilingual families will have higher verbal fluency at...
asked 10 minutes ago -
A fast food meal has 5660 kJ of energy. A person uses energy at
a rate...
asked 22 minutes ago -
The pKb for a generic amine(R-NH2)) in
aqueous solution is 6.30. What is its pKa?
asked 24 minutes ago -
The following reactions have the indicated equilibrium constants
at a particular temperature: N2(g) + O2(g) ⇌...
asked 26 minutes ago -
Please Help ASAP.
1Consider the below code which iterates over a linked
list of n nodes...
asked 42 minutes ago -
Determine the air to fuel ratio of:
Canadian natural gas, with 93.9% methane, 4.2% ethane, 0.3%...
asked 43 minutes ago -
A manufacturer of power tools claims that the average amount of
time required to assemble their...
asked 45 minutes ago -
"electron-withdrawing substituents on carbon encourage back
donation", then on the next page he says that "greater...
asked 56 minutes ago -
On December 31, 2016, the shareholders’ equity section of the
balance sheet of R & L...
asked 1 hour ago -
16.7
At t=0s a small "upward" (positive y) pulse centered at x = 5.0
m is...
asked 1 hour ago -
Twitter Users and News: A poll conducted in 2013 found that 52%
of U.S. adult Twitter...
asked 1 hour ago