 please help me answer questions 1 to 3. please show you work
clearly with the equations step by step. Thank you.
please help me answer questions 1 to 3. please show you work
clearly with the equations step by step. Thank you.Homework Answers
We would be looking at all the steps of the first question here on hypothesis test.
Q1) As we are testing here whether the population mean is equal to 76, therefore the null and the alternative hypothesis here are given as:


The test statistic here is computed as:
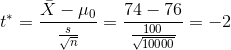
as this is a two tailed test, for n - 1 = 9999 degrees of
freedom, the p-value here is obtained from t distribution tables
as:
p = 2P( t9999 < -2) = 2*0.0228 = 0.0456
As we are doing the test at 95% confidence level, therefore level of significance = 1 - c = 5%.
As the p-value here is 0.0456 < 0.05, therefore the test is significant here and we can reject the null hypothesis here. Therefore we have sufficient evidence here that the mean is not equal to 76 here.
Add Answer to:
please help me answer questions 1 to 3. please show you work
clearly with the equations...
please help me answer questions 1,2, 3. Hypothesis Testing: 1. You are given the following information...
 please help me answer questions 1,2, 3.
Hypothesis Testing: 1. You are given the following information and then asked to do a hypothesis test with a 95% level of confidence to evaluate whether or not it is likely that the population mean is equal to 76 for a given variable. N=10,000 X-bar=74 s2=10,000 2. You are given the following information and then asked to do a hypothesis test with a 95% level of confidence to evaluate whether or not it...
please help me answer questions 1,2, 3.
Hypothesis Testing: 1. You are given the following information and then asked to do a hypothesis test with a 95% level of confidence to evaluate whether or not it is likely that the population mean is equal to 76 for a given variable. N=10,000 X-bar=74 s2=10,000 2. You are given the following information and then asked to do a hypothesis test with a 95% level of confidence to evaluate whether or not it...
Answer choice: A. ~99% B. ~95% C. ~90% *** please explain and show me your work! im trying to u...
 answer choice:
A. ~99%
B. ~95%
C. ~90%
*** please explain and show me your work! im trying to
understand and learn it on my own.
25) A researcher is interested in investigating the power of his statistical test analyzing the success rate of increasing forced vital capacity (FVC) in children with asthma. Suppose the researcher conducted a z test for significance with a SRS of 74on a population with a mean FVC of84% with a nullhypothesisthatm determined the standard...
answer choice:
A. ~99%
B. ~95%
C. ~90%
*** please explain and show me your work! im trying to
understand and learn it on my own.
25) A researcher is interested in investigating the power of his statistical test analyzing the success rate of increasing forced vital capacity (FVC) in children with asthma. Suppose the researcher conducted a z test for significance with a SRS of 74on a population with a mean FVC of84% with a nullhypothesisthatm determined the standard...
1. Please test hypothesis for a mean or for a proportion. Please state null and alternative...
1. Please test hypothesis for a mean or for a proportion. Please state null and alternative hypothesis Hypothesized mean = 125, sample mean = 135, standard deviation = 15; n= 500, confidence level = 95% 2. Test Hypotheses of population percent = 33%, sample percent = 31%,n= 120, confidence level = 99%
PART B: Written Questions. Please answer both questions, (40% each) 1. A large Irish sample survey...
 PART B: Written Questions. Please answer both questions, (40% each) 1. A large Irish sample survey asked each individual to describe their own health levels using five alternative categories. The numbers falling into each category were as follows: Self-Described Frequency Health Status Very Good Good 3270 3376 1260 244 air Bad Very Bad Total 51 8201 Calculate the proportion of the sample describing their health as either 'bad' or 'very bad' a construct a 95% confidence interval for the population...
need help, work shown would be so helpful so i can understand and please box answer clearly if you can!!! either way thank you so much in advance:) s. You are interested in whether a treatment ca...
 need help, work shown would be so helpful so i can understand
and please box answer clearly if you can!!! either way thank you so
much in advance:)
s. You are interested in whether a treatment causes an effect on a continuously measurable attribute. You use a treatment group with 7 cases and a control group with 7 cases. You decide to run a hypothesis test with a significance level of 0.01. Your data is below. Please use 10 for...
need help, work shown would be so helpful so i can understand
and please box answer clearly if you can!!! either way thank you so
much in advance:)
s. You are interested in whether a treatment causes an effect on a continuously measurable attribute. You use a treatment group with 7 cases and a control group with 7 cases. You decide to run a hypothesis test with a significance level of 0.01. Your data is below. Please use 10 for...
Please help me do it. And please tell me the way you do it, thank you:)
 Please help me do it.
And please tell me the way you do it, thank you:)
3. Eight students were sampled from a school with their final exam scores, Y, and hours studied, X. Assume the linear regression model is appropriate. hours studied 8 9 5 6 7 10 8 8 exam scores 78 85 65 70 75 90 82 80 2x61, y 625, 483 y,2 49283 , 2xyi-4855 (xi-x)2 17.875 , Oz_y)2 454.875 , (xī_x)(yi-у) 89.375 (a) Write down...
Please help me do it.
And please tell me the way you do it, thank you:)
3. Eight students were sampled from a school with their final exam scores, Y, and hours studied, X. Assume the linear regression model is appropriate. hours studied 8 9 5 6 7 10 8 8 exam scores 78 85 65 70 75 90 82 80 2x61, y 625, 483 y,2 49283 , 2xyi-4855 (xi-x)2 17.875 , Oz_y)2 454.875 , (xī_x)(yi-у) 89.375 (a) Write down...
Solve questions 4 and 5! Please show all calculations and work! Also show how you solved...
 Solve questions 4 and 5! Please show all calculations and
work! Also show how you solved them step by step please!!! No
excel!!
Determinants of college GPA (se in parentheses) collGPA1.39 .412 hsGPA+ .015 ACT- .083 skipped (.33) (.094) (.011) (.026) 1) For n=25, is hs GPA statistically significant at 95% confidence level? tCALC = 4.38 tCRIT = 2.08 tcuc > tCRIT YES, reject the null 2) For n=25, is hsGPA statistically significant at 99% confidence level? CALC- tCRIT 3)...
Solve questions 4 and 5! Please show all calculations and
work! Also show how you solved them step by step please!!! No
excel!!
Determinants of college GPA (se in parentheses) collGPA1.39 .412 hsGPA+ .015 ACT- .083 skipped (.33) (.094) (.011) (.026) 1) For n=25, is hs GPA statistically significant at 95% confidence level? tCALC = 4.38 tCRIT = 2.08 tcuc > tCRIT YES, reject the null 2) For n=25, is hsGPA statistically significant at 99% confidence level? CALC- tCRIT 3)...
1. Twenty male athletes were given a special candy bar daily for several weeks, and each...
1. Twenty male athletes were given a special candy bar daily for several weeks, and each man’s body weight was recorded. It is found that the mean change in body weight was +1.5 kg. The variance of these 20 data of weight-change has been estimated as s2 = 6.25 kg2. (50 pts) – t distribution and chi-square distribution tables are included. (a) Test the null hypothesis that the candy bar has NO significant effect on body weight. (b) Test the...
Please give the text answer do not with hand writing, Thanks Question 3 (4 marks) Part...
 Please give the text answer do not with hand writing, Thanks
Question 3 (4 marks) Part a) Given the following information X-500, σ=12, n=50 i) Determine the 95% confidence interval estimate of population mean. ii) Determine the 99% o confidence interval estimate of population mean Part b) A statistics practitioner calculated the mean and standard deviation from a sample of 51. They are X-120 and s-15. (i) Estimate the population mean with 95% confidence level (ii) Estimate the population mean...
Please give the text answer do not with hand writing, Thanks
Question 3 (4 marks) Part a) Given the following information X-500, σ=12, n=50 i) Determine the 95% confidence interval estimate of population mean. ii) Determine the 99% o confidence interval estimate of population mean Part b) A statistics practitioner calculated the mean and standard deviation from a sample of 51. They are X-120 and s-15. (i) Estimate the population mean with 95% confidence level (ii) Estimate the population mean...
 please help me answer questions 1,2, 3.
Hypothesis Testing: 1. You are given the following information and then asked to do a hypothesis test with a 95% level of confidence to evaluate whether or not it is likely that the population mean is equal to 76 for a given variable. N=10,000 X-bar=74 s2=10,000 2. You are given the following information and then asked to do a hypothesis test with a 95% level of confidence to evaluate whether or not it...
please help me answer questions 1,2, 3.
Hypothesis Testing: 1. You are given the following information and then asked to do a hypothesis test with a 95% level of confidence to evaluate whether or not it is likely that the population mean is equal to 76 for a given variable. N=10,000 X-bar=74 s2=10,000 2. You are given the following information and then asked to do a hypothesis test with a 95% level of confidence to evaluate whether or not it...
 answer choice:
A. ~99%
B. ~95%
C. ~90%
*** please explain and show me your work! im trying to
understand and learn it on my own.
25) A researcher is interested in investigating the power of his statistical test analyzing the success rate of increasing forced vital capacity (FVC) in children with asthma. Suppose the researcher conducted a z test for significance with a SRS of 74on a population with a mean FVC of84% with a nullhypothesisthatm determined the standard...
answer choice:
A. ~99%
B. ~95%
C. ~90%
*** please explain and show me your work! im trying to
understand and learn it on my own.
25) A researcher is interested in investigating the power of his statistical test analyzing the success rate of increasing forced vital capacity (FVC) in children with asthma. Suppose the researcher conducted a z test for significance with a SRS of 74on a population with a mean FVC of84% with a nullhypothesisthatm determined the standard...
 PART B: Written Questions. Please answer both questions, (40% each) 1. A large Irish sample survey asked each individual to describe their own health levels using five alternative categories. The numbers falling into each category were as follows: Self-Described Frequency Health Status Very Good Good 3270 3376 1260 244 air Bad Very Bad Total 51 8201 Calculate the proportion of the sample describing their health as either 'bad' or 'very bad' a construct a 95% confidence interval for the population...
 need help, work shown would be so helpful so i can understand
and please box answer clearly if you can!!! either way thank you so
much in advance:)
s. You are interested in whether a treatment causes an effect on a continuously measurable attribute. You use a treatment group with 7 cases and a control group with 7 cases. You decide to run a hypothesis test with a significance level of 0.01. Your data is below. Please use 10 for...
need help, work shown would be so helpful so i can understand
and please box answer clearly if you can!!! either way thank you so
much in advance:)
s. You are interested in whether a treatment causes an effect on a continuously measurable attribute. You use a treatment group with 7 cases and a control group with 7 cases. You decide to run a hypothesis test with a significance level of 0.01. Your data is below. Please use 10 for...
 Please help me do it.
And please tell me the way you do it, thank you:)
3. Eight students were sampled from a school with their final exam scores, Y, and hours studied, X. Assume the linear regression model is appropriate. hours studied 8 9 5 6 7 10 8 8 exam scores 78 85 65 70 75 90 82 80 2x61, y 625, 483 y,2 49283 , 2xyi-4855 (xi-x)2 17.875 , Oz_y)2 454.875 , (xī_x)(yi-у) 89.375 (a) Write down...
Please help me do it.
And please tell me the way you do it, thank you:)
3. Eight students were sampled from a school with their final exam scores, Y, and hours studied, X. Assume the linear regression model is appropriate. hours studied 8 9 5 6 7 10 8 8 exam scores 78 85 65 70 75 90 82 80 2x61, y 625, 483 y,2 49283 , 2xyi-4855 (xi-x)2 17.875 , Oz_y)2 454.875 , (xī_x)(yi-у) 89.375 (a) Write down...
 Solve questions 4 and 5! Please show all calculations and
work! Also show how you solved them step by step please!!! No
excel!!
Determinants of college GPA (se in parentheses) collGPA1.39 .412 hsGPA+ .015 ACT- .083 skipped (.33) (.094) (.011) (.026) 1) For n=25, is hs GPA statistically significant at 95% confidence level? tCALC = 4.38 tCRIT = 2.08 tcuc > tCRIT YES, reject the null 2) For n=25, is hsGPA statistically significant at 99% confidence level? CALC- tCRIT 3)...
Solve questions 4 and 5! Please show all calculations and
work! Also show how you solved them step by step please!!! No
excel!!
Determinants of college GPA (se in parentheses) collGPA1.39 .412 hsGPA+ .015 ACT- .083 skipped (.33) (.094) (.011) (.026) 1) For n=25, is hs GPA statistically significant at 95% confidence level? tCALC = 4.38 tCRIT = 2.08 tcuc > tCRIT YES, reject the null 2) For n=25, is hsGPA statistically significant at 99% confidence level? CALC- tCRIT 3)...
 Please give the text answer do not with hand writing, Thanks
Question 3 (4 marks) Part a) Given the following information X-500, σ=12, n=50 i) Determine the 95% confidence interval estimate of population mean. ii) Determine the 99% o confidence interval estimate of population mean Part b) A statistics practitioner calculated the mean and standard deviation from a sample of 51. They are X-120 and s-15. (i) Estimate the population mean with 95% confidence level (ii) Estimate the population mean...
Please give the text answer do not with hand writing, Thanks
Question 3 (4 marks) Part a) Given the following information X-500, σ=12, n=50 i) Determine the 95% confidence interval estimate of population mean. ii) Determine the 99% o confidence interval estimate of population mean Part b) A statistics practitioner calculated the mean and standard deviation from a sample of 51. They are X-120 and s-15. (i) Estimate the population mean with 95% confidence level (ii) Estimate the population mean...
Most questions answered within 3 hours.
-
26) Briefly describe, using words or simple diagrams, the
chemiosmotic theory for coupling oxidation to phosphorylation...
asked 1 hour ago -
Suppose that XX is a random variable with mean 16 and standard
deviation 5 . Also...
asked 2 hours ago -
Calculate the number density of argon gas at a temperature of
24C and a pressure of...
asked 5 hours ago -
Alternative
Classification
How to Estimate
Probabilities from Data? ( For continuous Attributes)
And How to generate...
asked 5 hours ago -
An explosion breaks a 20.0-kg object into three parts. The
object is initially moving at a...
asked 6 hours ago -
Calculate the approximate number of residues of Rubisco, which
is involved in carbon fixation in plants,...
asked 7 hours ago -
Other decisions about scientific claims can have a much broader
impact.ENERGYarrow-10x10.png, environment, health, security - all...
asked 8 hours ago -
I need to write a research paper and work cited about this
topic: The United States...
asked 8 hours ago -
Hello! I was wondering if I could have some help?
If the vapor pressure of carvone...
asked 8 hours ago -
An economist wants to estimate the mean per capita income (in
thousands of dollars) for a...
asked 9 hours ago -
What would be the input/output characteristic of a circuit
obtained by putting two of your 2's-complementers...
asked 9 hours ago -
In Drosophila, the transition from the syncytial blastoderm
stage to the cellular blastoderm stage is a...
asked 9 hours ago